
9: In-class Activities
- Page ID
- 5439

\( \newcommand{\vecs}[1]{\overset { \scriptstyle \rightharpoonup} {\mathbf{#1}} } \)
\( \newcommand{\vecd}[1]{\overset{-\!-\!\rightharpoonup}{\vphantom{a}\smash {#1}}} \)
\( \newcommand{\dsum}{\displaystyle\sum\limits} \)
\( \newcommand{\dint}{\displaystyle\int\limits} \)
\( \newcommand{\dlim}{\displaystyle\lim\limits} \)
\( \newcommand{\id}{\mathrm{id}}\) \( \newcommand{\Span}{\mathrm{span}}\)
( \newcommand{\kernel}{\mathrm{null}\,}\) \( \newcommand{\range}{\mathrm{range}\,}\)
\( \newcommand{\RealPart}{\mathrm{Re}}\) \( \newcommand{\ImaginaryPart}{\mathrm{Im}}\)
\( \newcommand{\Argument}{\mathrm{Arg}}\) \( \newcommand{\norm}[1]{\| #1 \|}\)
\( \newcommand{\inner}[2]{\langle #1, #2 \rangle}\)
\( \newcommand{\Span}{\mathrm{span}}\)
\( \newcommand{\id}{\mathrm{id}}\)
\( \newcommand{\Span}{\mathrm{span}}\)
\( \newcommand{\kernel}{\mathrm{null}\,}\)
\( \newcommand{\range}{\mathrm{range}\,}\)
\( \newcommand{\RealPart}{\mathrm{Re}}\)
\( \newcommand{\ImaginaryPart}{\mathrm{Im}}\)
\( \newcommand{\Argument}{\mathrm{Arg}}\)
\( \newcommand{\norm}[1]{\| #1 \|}\)
\( \newcommand{\inner}[2]{\langle #1, #2 \rangle}\)
\( \newcommand{\Span}{\mathrm{span}}\) \( \newcommand{\AA}{\unicode[.8,0]{x212B}}\)
\( \newcommand{\vectorA}[1]{\vec{#1}} % arrow\)
\( \newcommand{\vectorAt}[1]{\vec{\text{#1}}} % arrow\)
\( \newcommand{\vectorB}[1]{\overset { \scriptstyle \rightharpoonup} {\mathbf{#1}} } \)
\( \newcommand{\vectorC}[1]{\textbf{#1}} \)
\( \newcommand{\vectorD}[1]{\overrightarrow{#1}} \)
\( \newcommand{\vectorDt}[1]{\overrightarrow{\text{#1}}} \)
\( \newcommand{\vectE}[1]{\overset{-\!-\!\rightharpoonup}{\vphantom{a}\smash{\mathbf {#1}}}} \)
\( \newcommand{\vecs}[1]{\overset { \scriptstyle \rightharpoonup} {\mathbf{#1}} } \)
\(\newcommand{\longvect}{\overrightarrow}\)
\( \newcommand{\vecd}[1]{\overset{-\!-\!\rightharpoonup}{\vphantom{a}\smash {#1}}} \)
\(\newcommand{\avec}{\mathbf a}\) \(\newcommand{\bvec}{\mathbf b}\) \(\newcommand{\cvec}{\mathbf c}\) \(\newcommand{\dvec}{\mathbf d}\) \(\newcommand{\dtil}{\widetilde{\mathbf d}}\) \(\newcommand{\evec}{\mathbf e}\) \(\newcommand{\fvec}{\mathbf f}\) \(\newcommand{\nvec}{\mathbf n}\) \(\newcommand{\pvec}{\mathbf p}\) \(\newcommand{\qvec}{\mathbf q}\) \(\newcommand{\svec}{\mathbf s}\) \(\newcommand{\tvec}{\mathbf t}\) \(\newcommand{\uvec}{\mathbf u}\) \(\newcommand{\vvec}{\mathbf v}\) \(\newcommand{\wvec}{\mathbf w}\) \(\newcommand{\xvec}{\mathbf x}\) \(\newcommand{\yvec}{\mathbf y}\) \(\newcommand{\zvec}{\mathbf z}\) \(\newcommand{\rvec}{\mathbf r}\) \(\newcommand{\mvec}{\mathbf m}\) \(\newcommand{\zerovec}{\mathbf 0}\) \(\newcommand{\onevec}{\mathbf 1}\) \(\newcommand{\real}{\mathbb R}\) \(\newcommand{\twovec}[2]{\left[\begin{array}{r}#1 \\ #2 \end{array}\right]}\) \(\newcommand{\ctwovec}[2]{\left[\begin{array}{c}#1 \\ #2 \end{array}\right]}\) \(\newcommand{\threevec}[3]{\left[\begin{array}{r}#1 \\ #2 \\ #3 \end{array}\right]}\) \(\newcommand{\cthreevec}[3]{\left[\begin{array}{c}#1 \\ #2 \\ #3 \end{array}\right]}\) \(\newcommand{\fourvec}[4]{\left[\begin{array}{r}#1 \\ #2 \\ #3 \\ #4 \end{array}\right]}\) \(\newcommand{\cfourvec}[4]{\left[\begin{array}{c}#1 \\ #2 \\ #3 \\ #4 \end{array}\right]}\) \(\newcommand{\fivevec}[5]{\left[\begin{array}{r}#1 \\ #2 \\ #3 \\ #4 \\ #5 \\ \end{array}\right]}\) \(\newcommand{\cfivevec}[5]{\left[\begin{array}{c}#1 \\ #2 \\ #3 \\ #4 \\ #5 \\ \end{array}\right]}\) \(\newcommand{\mattwo}[4]{\left[\begin{array}{rr}#1 \amp #2 \\ #3 \amp #4 \\ \end{array}\right]}\) \(\newcommand{\laspan}[1]{\text{Span}\{#1\}}\) \(\newcommand{\bcal}{\cal B}\) \(\newcommand{\ccal}{\cal C}\) \(\newcommand{\scal}{\cal S}\) \(\newcommand{\wcal}{\cal W}\) \(\newcommand{\ecal}{\cal E}\) \(\newcommand{\coords}[2]{\left\{#1\right\}_{#2}}\) \(\newcommand{\gray}[1]{\color{gray}{#1}}\) \(\newcommand{\lgray}[1]{\color{lightgray}{#1}}\) \(\newcommand{\rank}{\operatorname{rank}}\) \(\newcommand{\row}{\text{Row}}\) \(\newcommand{\col}{\text{Col}}\) \(\renewcommand{\row}{\text{Row}}\) \(\newcommand{\nul}{\text{Nul}}\) \(\newcommand{\var}{\text{Var}}\) \(\newcommand{\corr}{\text{corr}}\) \(\newcommand{\len}[1]{\left|#1\right|}\) \(\newcommand{\bbar}{\overline{\bvec}}\) \(\newcommand{\bhat}{\widehat{\bvec}}\) \(\newcommand{\bperp}{\bvec^\perp}\) \(\newcommand{\xhat}{\widehat{\xvec}}\) \(\newcommand{\vhat}{\widehat{\vvec}}\) \(\newcommand{\uhat}{\widehat{\uvec}}\) \(\newcommand{\what}{\widehat{\wvec}}\) \(\newcommand{\Sighat}{\widehat{\Sigma}}\) \(\newcommand{\lt}{<}\) \(\newcommand{\gt}{>}\) \(\newcommand{\amp}{&}\) \(\definecolor{fillinmathshade}{gray}{0.9}\)Chapter 1 Data and Statistics
- A survey question asked whether you were looking forward to the time when most of the cars on the road were self-driving (autonomous) cars, and the choice of answers was yes or no.
a. Is the data from the responses to this question categorical or quantitative?
b. Is the appropriate statistic \(\hat{p}\) or \(\bar{x}\)?
c. The table below gives the responses to 20 questions. Calculate the value of the appropriate statistic used for the answer yes.no yes yes yes no no yes no no yes yes no yes no yes no yes yes yes no - In the school’s cafeteria, an employee counted the number of people sitting at each table.
a. Is the data from the responses to this question categorical or quantitative?
b. Is the appropriate statistic \(\hat{p}\) or \(\bar{x}\)?
c. The table below gives the number at 10 different tables. Calculate the value of the appropriate statistic.
5 6 8 7 4 1 7 8 3 1
Chapter 1 Writing Hypotheses
Name___________________________ Effort _____/4 Attendance ____/1 Total ____/5
- The equal sign must always go in the null hypothesis (\(H_0\))
- The equal sign may never appear in the alternate hypothesis (\(H_1\))
- The alternate hypothesis uses one of the following: <, >, \(\ne\)
- Both hypotheses must be about the same parameter (mean (μ) or proportion (p)). If the hypothesis is about a proportion then use \(H_0: p = a\) number between 0 and 1. If the hypothesis is about a mean, use \(H_0: \mu = a\) number.
- The number in the null and alternate hypothesis must be the same.
Example: What proportion of students ate breakfast today?
\(H_0: p = 0.60\)
\(H_1: p < 0.60\)
Example: What is the average number of calories consumed for breakfast today by students?
\(H_0: \mu = 200\)
\(H_1: \mu > 200\)
Write your hypotheses for each question. Use each of the three inequalities at least once.
- What is the average heart rate of college students?
\(H_0: \)
\(H_1: \)
- Given the choice between humanity creating a fantastic future with technology or suffering a collapse of society due to resource depletion and other environmental problems, what proportion of college students do you hypothesize believes the future will be fantastic?
\(H_0: \)
\(H_1: \)
- What is the average time, in minutes, that it takes students to get to school in the morning?
\(H_0: \)
\(H_1: \)
- What proportion of students eat raw cookie dough?
\(H_0: \)
\(H_1: \)
Chapter 1 Sampling Distributions
1. In the distribution to the right: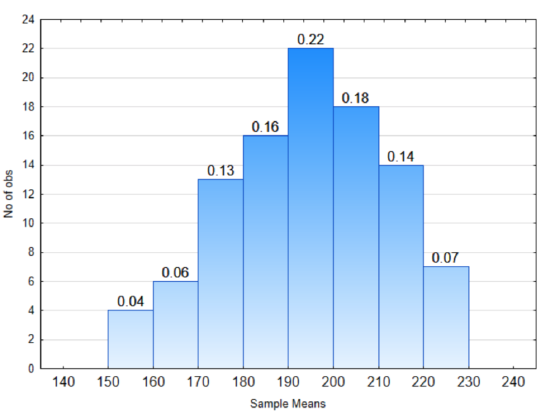
What proportion of sample means will be between 150 and 170?
What proportion of sample means will be between 200 and 230?
What proportion of sample means will be between 150 and 230?
2. In the distribution to the right: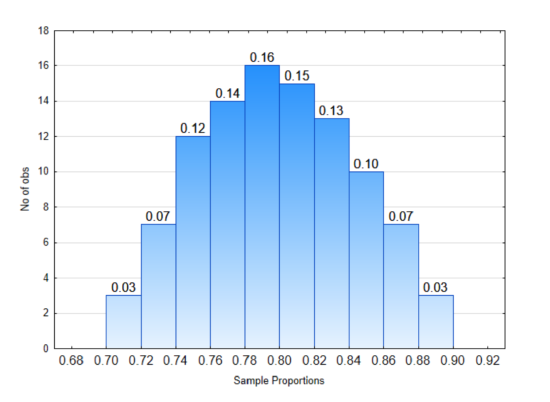
What proportion of sample proportions will be between 0.70 and 0.74?
What proportion of sample proportions will be between 0.84 and 0.90?
What proportion of sample proportions will be less than 0.70?
Chapter 2 p-values and levels of significance
- For each row of the table you are given a p-value and a level of significance (\(\alpha\)). Determine which hypothesis is supported, if the data are significant and which type error could be made. If a given p-value is not a valid p-value, put an x in each box in the row.
p - value \(\alpha\) Hypothesis \(H_0\) or \(H_1\) Significant or Not Significant Error
Type I or Type II0.48 0.05 0.023 0.10 6.7E-6 0.01 Identify each as true or false if data are not significant
_____ The null hypothesis is definitely true
_____ The alternative hypothesis is definitely true
_____ The alternative hypothesis is rejected
_____ The null hypothesis was not rejected
_____The p-value is larger than \(\alpha\)
- For each row of the table you are given a p-value and a level of significance (\(\alpha\)). Determine which hypothesis is supported, if the data are significant and which type error could be made. If a given p-value is not a valid p-value, put an x in each box in the row.
p - value \(\alpha\) Hypothesis \(H_0\) or \(H_1\) Significant or Not Significant Error
Type I or Type II0.048 0.05 0.0023 0.10 6.70 0.01
Identify each as true or false if data are not significant
_____ The null hypothesis is definitely true
_____ The alternative hypothesis is definitely true
_____ The alternative hypothesis is rejected
_____ The null hypothesis was not rejected
_____The p-value is larger than \(\alpha\)
Elementary Hypothesis Test, Example 1 Arsenic
Briefing: Arsenic is a naturally occurring element and also a human produced element (e.g. fracking, combustion of coal) that can be found in ground water. It causes a variety of health problems and can lead to death. The EPA limit is 10 ppb, meaning 10 ppb or higher is unsafe. Problem: Fracking was started in your community. A year later, sickness in the community leads health department officials to test your water to determine if it is contaminated with arsenic. The official will take 5 samples of water over the next 2 months and decide whether you have safe water or unsafe water based on the average of these samples. The hypotheses to be tested are: \(H_0: \mu = 10\) (Not safe) \(H_1: \mu < 10\) (Safe). The level of significance is: \(\alpha = 0.12\).
Assume these are the two possible distributions that exist.
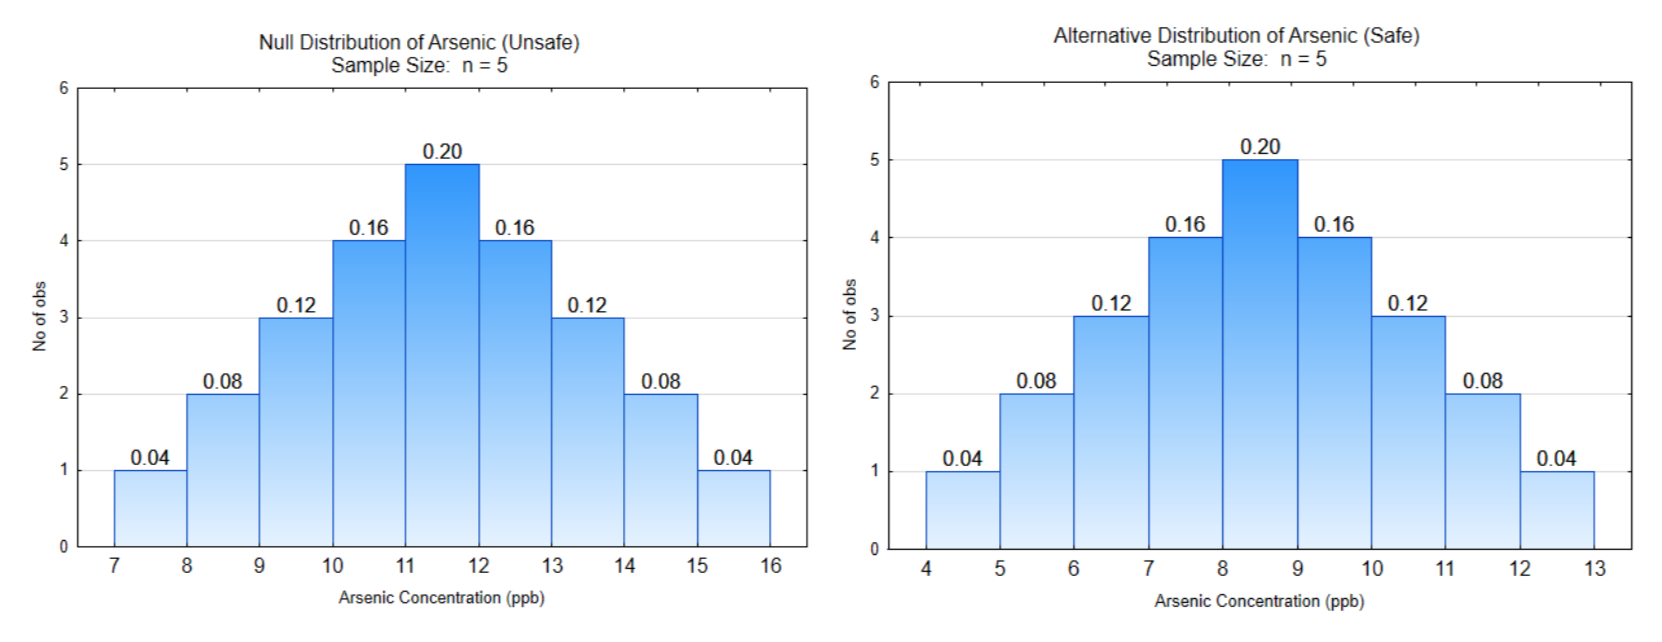
What is the direction of the extreme?
Show the decision line on both distributions.
What is the critical value?
Label \(\alpha\), \(\beta\), and power
What is the probability of \(\alpha\)?
What is the probability of \(\beta\)?
What is the power?
What is the consequence of a Type I error?
What is the consequence of a Type II error?
Data: What you select from the container that was passed around the classroom
Write a concluding sentence:
What decision do you make about your house and water supply?
Elementary Hypothesis Test, Example 2: Do a majority of people in the US believe it is time for a new voting system?
Briefing: The plurality voting system has been used in this, and other countries, since the democracies were formed. However, this system has led to the domination of two parties which don’t necessarily reflect the opinions of the citizens. Some countries, such as New Zealand, and some states and communities in the US have adopted other voting systems which allow for better representation. Imagine a survey in which people were asked if they think it is time to change the voting system as a solution to the decisive partisanship that currently exists in the US. The objective is to determine if a majority of voters are ready to explore alternative voting systems. The hypotheses are: \(H_0: p = 0.50\), \(H_1: p > 0.50\), \(\alpha = 0.07\).
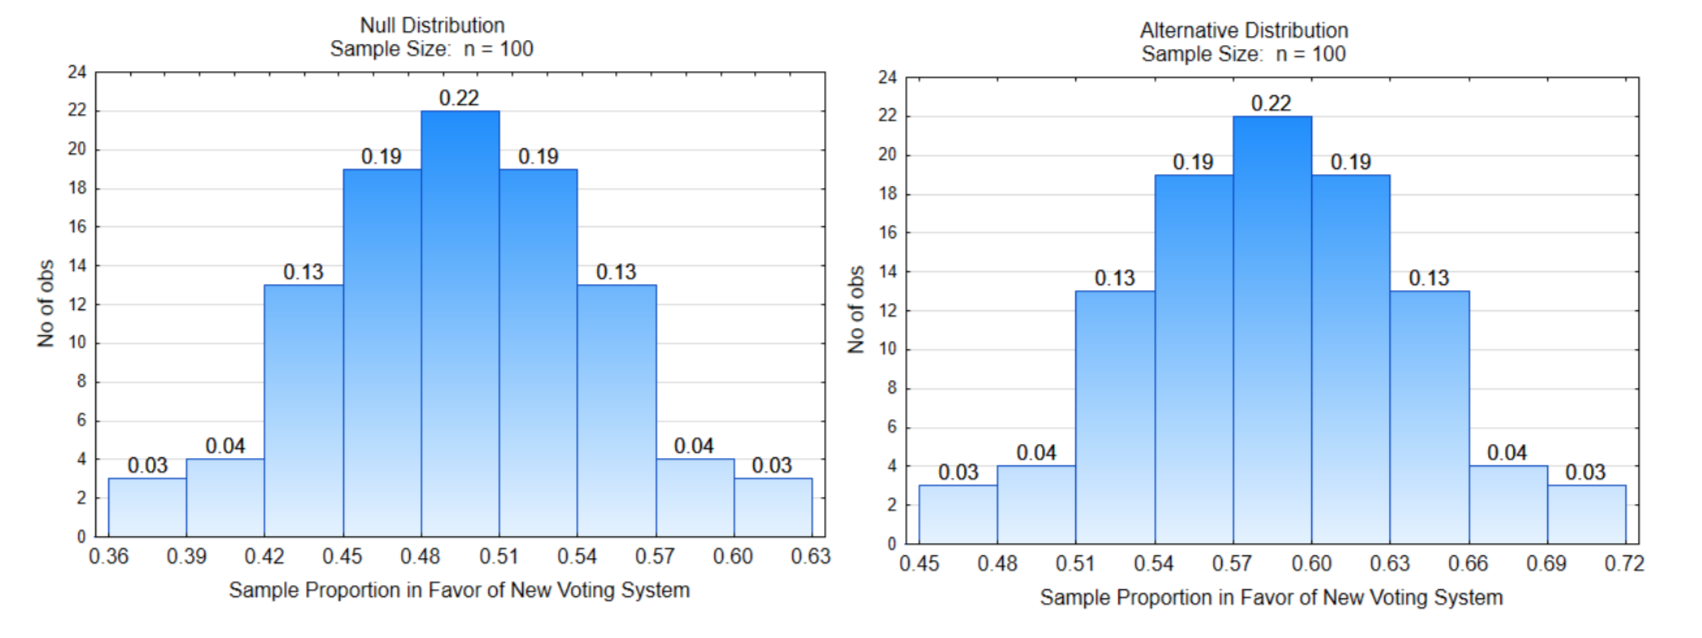
What is the direction of the extreme?
Show the decision line on both distributions.
What is the critical value?
Label \(\alpha\), \(\beta\), and power
What is the probability of \(\alpha\)?
What is the probability of \(\beta\)?
What is the power?
What is the consequence of a Type I error?
What is the consequence of a Type II error?
Data: 54 out of 100 voters wanted to explore alternative voting systems.
What is the sample proportion?
Write a concluding sentence:
Chapter 2 Design Tables
- In an effort to determine which strategy is most effective for losing weight, a researcher randomly assigns subjects to one of four groups. One group (exercise) will become involved in a regular exercise program, a second group will be fed a balanced diet (food) but with appropriate size portions, a third group (exercise and food) will use both the exercise program and the balanced diet, while the fourth group (no change) will not change their diet or exercise.
Research Design Table Research Question: Type of Research Observational Study
Observational Experiment
Manipulative ExperimentWhat is the response variable? What is the parameter that will be calculated? Mean Proportion List potential confounding variables. Grouping/explanatory Variables 1 (if present) Levels: - People get excited when a young athlete achieves great success but there is always the question of whether the best college athletes were actually among the best young athletes. If interviews of starting varsity athletes from Division 1 schools were done and they were asked if they were considered a superior athlete as a 10 year old in their sport, would the proportion that were successful as a young child be different for males and females?
Research Design Table Research Question: Type of Research Observational Study
Observational Experiment
Manipulative ExperimentWhat is the response variable? What is the parameter that will be calculated? Mean Proportion List potential confounding variables. Grouping/explanatory Variables 1 (if present) Levels:
Chapter 2 Random Numbers
1. A survey at our college will be done. The administration expects different responses from running start students, traditional students, returning students and veterans. Sampling will be done from each of these groups.
What sampling method is being used?
If there are 1320 veterans (1-1320), what are the numbers of the first 3 randomly selected veterans if a seed value of 3 is used?
2. Time series data will be selected 5 years apart so that the data are independent. What are the numbers of the first 3 randomly selected years of data if the first year of data is 1960? Use a seed value of 4.
Chapter 2 Compare and Contrast Sampling Methods
Name___________________________ Effort_____/5 Attendance ____/1 Total ___/6
A current debate in Washington is whether to build coal export terminals so that coal mined in Montana and Wyoming can be sent by train to the Washington, Oregon or British Columbia coast and then exported to Asia. Some concerns include long trains that will be a constant disruption to traffic, coal dust from the trains will pollute the air near the rail lines, water pollution that will destroy the fisheries and fishing industry, and the concern that coal will contribute to climate change. Suppose a task force of 100 people from Idaho, Washington, Oregon and British Columbia gather to determine a regional policy for this situation. The task force is made up of government officials (G) and public citizens (C). They have all been assigned a number from 1 to 100. All sampling will be done with replacement. That means you can use the same number twice within one sampling method. This activity is meant to allow you to compare and contrast the 4 sampling methods.
| Group 1 Idaho |
Group 2 Washington |
Group 3 Oregon |
Group 4 British Columbia |
||||
| 1 -C | No Coal | 23 -G | No Coal | 49 -G | Terminals | 71 -C | Terminals |
| 2 -C | Terminals | 24 -C | Terminals | 50 -G | No Coal | 72 -G | Terminals |
| 3 -C | Terminals | 25 -G | No Coal | 51 -G | No Coal | 73 -C | No Coal |
| 4 -C | Terminals | 26 -G | No Coal | 52 -G | No Coal | 74 -G | Terminals |
| 5 -C | No Coal | 27 -C | Terminals | 53 -C | No Coal | 75 -C | Terminals |
| 6 -C | Terminals | 28 -G | No Coal | 54 -C | Terminals | 76 -C | Terminals |
| 7 -C | Terminals | 29 -G | No Coal | 55 -G | No Coal | 77 -C | Terminals |
| 8 -G | No Coal | 30 -G | No Coal | 56 -C | No Coal | 78 -G | Terminals |
| 9 -G | Terminals | 31 -C | No Coal | 57 -G | No Coal | 79 -G | Terminals |
| 10 -G | No Coal | 32 -C | Terminals | 58 -G | No Coal | 80 -C | Terminals |
| 11 -C | Terminals | 33 -G | Terminals | 59 -G | No Coal | 81 -C | No Coal |
| 12 -G | No Coal | 34 -G | Terminals | 60 -C | No Coal | 82 -G | Terminals |
| 13 -G | Terminals | 35 -G | Terminals | 61 -C | Terminals | 83 -G | Terminals |
| 14 -G | No Coal | 36 -G | Terminals | 62 -G | No Coal | 84 -C | No Coal |
| 15 -G | Terminals | 37 -C | Terminals | 63 -C | No Coal | 85 -C | No Coal |
| 16 -G | No Coal | 38 -G | Terminals | 64 -C | Terminals | 86 -G | Terminals |
| 17 -C | Terminals | 39 -C | Terminals | 65 -C | Terminals | 87 -C | No Coal |
| 18 -G | No Coal | 40 -G | No Coal | 66 -G | No Coal | 88 -C | Terminals |
| 19 -G | Terminals | 41 -G | No Coal | 67 -G | Terminals | 89 -G | No Coal |
| 20 -G | Terminals | 42 -G | Terminals | 68 -G | No Coal | 90 -G | No Coal |
| 19 -C | Terminals | 43 -G | No Coal | 69 -C | Terminals | 91 -G | No Coal |
| 22 -G | No Coal | 44 -C | No Coal | 70 -C | Terminals | 92 -C | Terminals |
| 45 -C | No Coal | 93 -G | No Coal | ||||
| 46 -C | No Coal | 94 -C | No Coal | ||||
| 47 -G | No Coal | 95 -G | No Coal | ||||
| 48 -G | No Coal | 96 -G | Terminals | ||||
| 97 -G | Terminals | ||||||
| 98 -C | Terminals | ||||||
| 99 -C | Terminals | ||||||
| 100 -G | Terminals | ||||||
1. Simple Random Sample
Use your calculator with a seed of 23 to randomly select a sample of size 10. The lowest number is 1 and the highest is 100. List the selected numbers then determine the proportion of the sample that is against the coal terminals (No Coal).
Number: _____, _____, _____, _____, _____, _____, _____, _____, _____, _____,
N or T _____, _____, _____, _____, _____, _____, _____, _____, _____, _____,
Proportion that is against the coal terminals: \(\hat{p} =\) _____
2. Stratified Random Sample
Use your calculator with a seed of 13. The low is 1 and the high is 100. Put the random numbers in the appropriate strata. When a stratum is filled, ignore other numbers that belong in it.
Citizens: Number _____, _____, _____, _____, _____,
N or T _____, _____, _____, _____, _____,
Government: Number _____, _____, _____, _____, _____,
N or T _____, _____, _____, _____, _____,
Proportion (use citizens and government officials combined) that is against coal terminals: \(\hat{p} =\) _____
3. Systematic Random Sample
Use a 1 in K sampling method, with k = 10 to randomly select a sample of size 10. To determine the first number selected, use your calculator with a seed of 18, a low of 1 and a high of 10. Determine the proportion of the sample that is against coal terminals.
Number: _____, _____, _____, _____, _____, _____, _____, _____, _____, _____,
N or T _____, _____, _____, _____, _____, _____, _____, _____, _____, _____,
Proportion that is against coal terminals: \(\hat{p} =\) _____
4. Cluster Sampling
Use your calculator with a seed value of 33 to randomly select one of the groups (1-4). Which group is selected? _____________. What is the sample proportion of the selected group that is against coal terminals? \(\hat{p} =\) _____
Chapter 3 Histograms and Box Plots
Name___________________________ Effort_____/5 Attendance ____/1 Total ___/6
The results of an exam on Chapters 2 and 3 from one statistics class are shown in the table below. The numbers represent the percent of possible points the student earned.
| 76.8 | 91.5 | 98.8 | 97.6 | 76.8 | 93.9 | 57.3 | 86.6 | 90.2 |
| 93.9 | 93.9 | 82.9 | 92.7 | 89.0 | 72.0 | 57.3 | 93.9 | 92.7 |
| 93.9 | 81.7 | 63.4 | 68.3 | 85.4 | 50.0 | 84.1 | 90.2 | 86.6 |
| 97.6 | 84.1 | 81.7 | 95.1 | 87.8 | 75.6 | 92.7 | 73.2 | 91.5 |
Low value ___________ High value _____________
Make a frequency distribution. Use interval notation for the boundaries [lower,upper).
| Classes | |
Make a histogram. Label completely.
Use your calculator to complete the table below by entering the original data into the lists.
|
Mean |
|
|
Standard Deviation Sx |
|
|
Minimum |
|
|
Q1 |
|
|
Median |
|
|
Q3 |
|
|
Maximum |
Make a box plot. Label completely.
Chapter 4 Inferential Theory
Question 2: Do more than 70% of Americans drink tea (either hot or iced)?
a. Write your null and alternate hypothesis:
b. Find P(S): c. Find P(F):
d. If you took a sample of 7 people, what is the probability the exact order would be SFSSFSS? That is, find P(SFSSFSS).
e. How many combinations are there for 5 successes in a sample of 7 people?
f. What is the probability you would get 5 successes in a sample of 7 people?
g. Make a binomial distribution for the number of successes in a sample of 7 people.
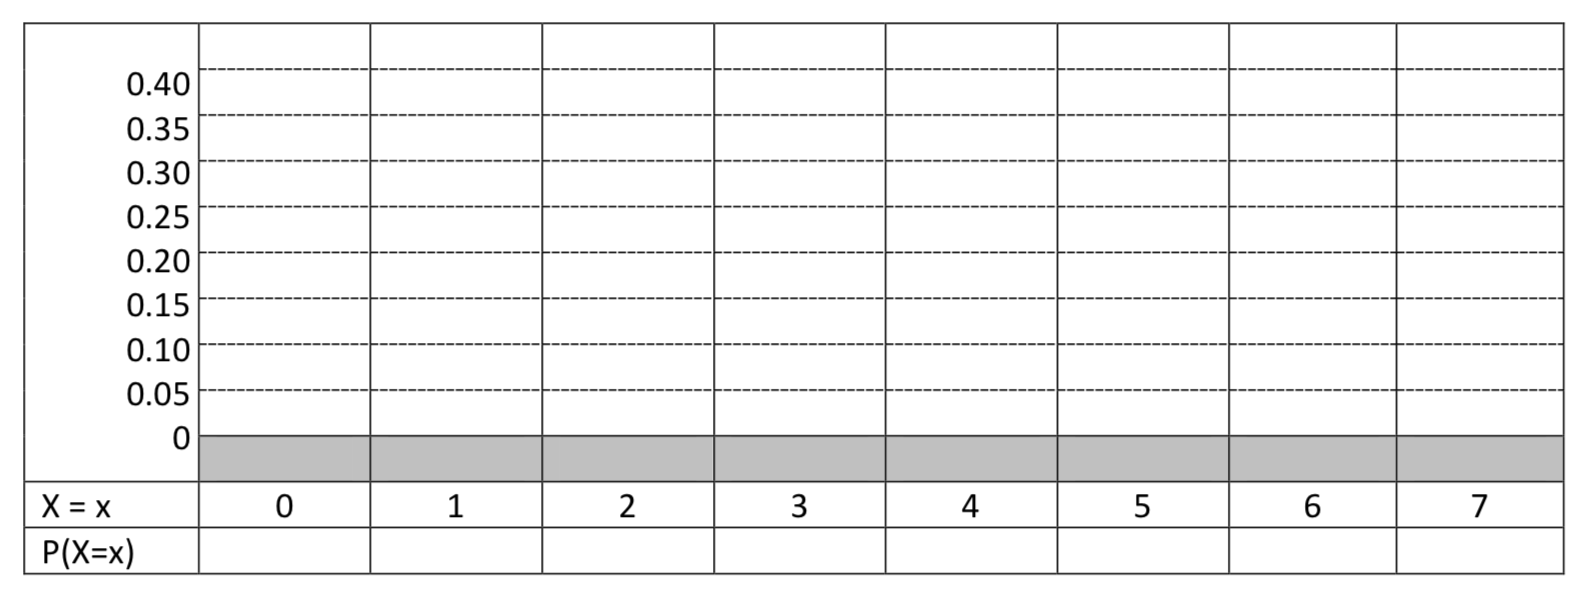
h. What is the mean and standard deviation for this distribution?
i. Finish the concluding sentence if there were 5 successes in a sample of 7 people. At the 5% level of significance, the proportion of Americans who drink tea __________________________________________________________________________________________________________________________
Chapter 4 Inferential Theory – Testing Hypotheses
Pacific Northwest residents are often concerned with the issue of sustainability. If a survey of 400 Pacific Northwest individuals resulted in 296 who said they make choices based on being sustainable, then test the hypothesis that over 67% of individuals in this region make choices based on being sustainable.
Test the hypotheses (\(H_0: p = 0.67\) \(H_1: p > 0.67\)) using three different methods and a level of significance of 0.05. For each method, you will be asked which hypothesis is supported.
1a. Binomial Distribution: Use the binomial distribution to calculate the exact p-value based on the data (296 out of 400).
__________________________ ___________________
Calculator input p-value
Which hypothesis is supported by the data? Choose 1: \(H_0\) \(H_1\)
1b. Normal Approximation: Use the normal approximation to the binomial distribution to calculate the approximate p-value based on the data (296 out of 400). Provide the requested information.
\(\mu = np = \) , \(\sigma = \sqrt{npq} =\)
Formula Substitution z value p-value
Which hypothesis is supported by the data? Choose 1: \(H_0\) \(H_1\)
1c. Sampling Distribution for Sample Proportions: Find the p-value using sample proportions for the data (296 out of 400). Provide the requested information.
Sample proportion
Formula Substitution z value p-value
Which hypothesis is supported by the data? Choose 1: \(H_0\) \(H_1\)
A student at UC Santa Barbara(http://www.culturechange.org/cms/content/view/704/62/) did some research on the plastic red cups that people use for drinks at parties. These cups are made of Polystyrene, which cannot be recycled in Santa Barbara. Many of the cups end up in the landfill, but some end up in the ocean. In the nearby college town of Isla Vista, the researcher estimated that the average number of cups used per person per year was 58. Assume the standard deviation is 8.
In an effort to change the culture, suppose an education campaign was used to reduce the number of red cups by encouraging the purchase of beverages in cans (since they can be recycled). To determine if this is effective, a random sample of 16 students will keep track of the number of red cups they use throughout the year. The hypotheses that will be tested are: \(H_0: \mu = 58\) \(H_1: \mu < 58\), \(\alpha = 0.05\)
2a. What is the mean of the sampling distribution of sample means? \(\mu_{\bar{x}}\) ________
2b. What is the standard deviation of the sampling distribution of sample means? \(\sigma_{\bar{x}}\) _________
2c. Draw and label a normal distribution showing the mean and first three standard deviations (standard errors) on each side of the mean for the distribution of sample means of 16 students.
2d, Test the hypothesis if the sample mean of the 16 students is 55 using a level of significance of \(\alpha = 0.05\).
Formula Substitution z value p-value
2e. Based on the results in this experiment, has there been a reduction in the use of red cups? Choose 1: Yes No
Chapters 5 and 6 Mixed Practice with Hypothesis Testing and Confidence Intervals
For each problem, provide the hypotheses and test the hypotheses by calculating the test statistic and p-value. Fill in all the blanks in the following sentence. Also, give calculator answer in parentheses for the test statistic and p-value. This will not be corrected or graded but will help prepare you for the exam.
1. A student read that in the bay area of California, the average person produces 2 pounds of garbage per day. The student believed that she produced less than that but wanted to test her hypothesis statistically. She collected data on 10 randomly selected days. Use \(\alpha = 0.05\).
| 2.0 | 2.3 | 1.9 | 1.9 | 2.3 |
| 1.2 | 2.3 | 2.1 | 1.7 | 1.8 |
\(H_0:\)
\(H_1:\)
What is the sample mean? Sample Mean ______________
What is the sample standard deviation? Sample Standard Deviation______________
Formula Substitution Test Statistic value p-value
Calculator:
Test Statistic value p-value
The average amount of garbage produced daily by the student ___________ significantly less than 2 pounds (t = __________, p = _____________, n=_______________).
What is the 95% confidence interval for the amount of garbage she produces?
Formula Substitution Margin of Error Confidence Interval
Calculator confidence Interval: __________________
2. A living wage is the hourly rate that an individual must earn to support their family, if they are the sole provider and are working full-time. In 2005, it was estimated that 33% of the job openings had wages that were inadequate (below the living wage). A researcher wishes to determine if that is still the case. In a sample of 460 jobs, 207 had wages that were inadequate.Test the claim that the proportion of jobs with inadequate wages is greater than 0.33. Let \(\alpha =\) 0.01.
\(H_0\) \(H_1\)
Formula Substitution Test Statistic value p-value
Calculator:
Test Statistic value p-value
What is the 90% confidence interval for the proportion of jobs with inadequate wages?
Formula Substitution Margin of Error Confidence Interval
Calculator confidence Interval: __________________
3. Suppose you had two different ways to get to school. One way was on main roads with a lot of traffic lights, the other way was on back roads with few traffic lights. You would like to know which way is faster. You randomly select 6 days to use the main road and 6 days to use the back roads. Your objective is to determine if the mean time it takes on the back road μb is different than the mean time on the main road μm. The data is presented in the table below. The units are minutes. Assume population variances are equal. Because the sample size is small, you decide touse a significance level of \(\alpha = 0.1\).
| Back Road | 14.5 | 15.0 | 16.2 | 18.9 | 21.3 | 17.4 |
| Main Road | 19.5 | 17.3 | 21.2 | 20.9 | 21.1 | 17.7 |
Write the appropriate null and alternate hypotheses: H0: _____________ H1:______________
What is the sample mean for each route? Back Road__________ Main Road ______
What is the sample standard deviation for each route? Back Road__________ Main Road ______
Test this using your calculator
Test Statistic value p-value
There _____________ a significant difference between taking the back road and the main road (t = ______, p = ___________, n=_______).
What is the 99% confidence interval for the difference in the mean times?
Calculator confidence Interval: __________________
Use your calculator generated confidence interval to calculate the margin of error ____________
4. Some parents of age group athletes believe their child will be better if they pay them a financial reward for being successful. For example they may pay $5 for scoring a goal in soccer or $1 for a best time at a swim meet. The argument against paying is that it is counterproductive and destroys the child’s self-motivation. Is the dropout rate of children that have been paid different than of children who have not been paid? Let \(\alpha = 0.05\).
Dropout rate of children who have been paid: 450 out of 510
Dropout rate of children who have not been paid: 780 out of 930
\(H_0\) \(H_1\)
Test this using your calculator
Test Statistic value p-value
What is the 95% confidence interval for the difference between the dropout rate of children that have been paid and children who have not been paid? Let α = 0.05.
Calculator confidence interval: __________________
Use your calculator generated confidence interval to calculate the margin of error ____________
Chapter 7 – Linear Regression Analysis
Homework problem 4 looks at the relationship between the population of a metropolitan area and the number of patents produced in that area. Below is an expand sample. It includes more of the large metropolitan areas. Make a new scatter plot. Use a different color marker to Indicate Las Vegas and Fresno on this scatter plot. In the homework, these two communities looked like outliers. Do they still?
Use a 5% level of significance.
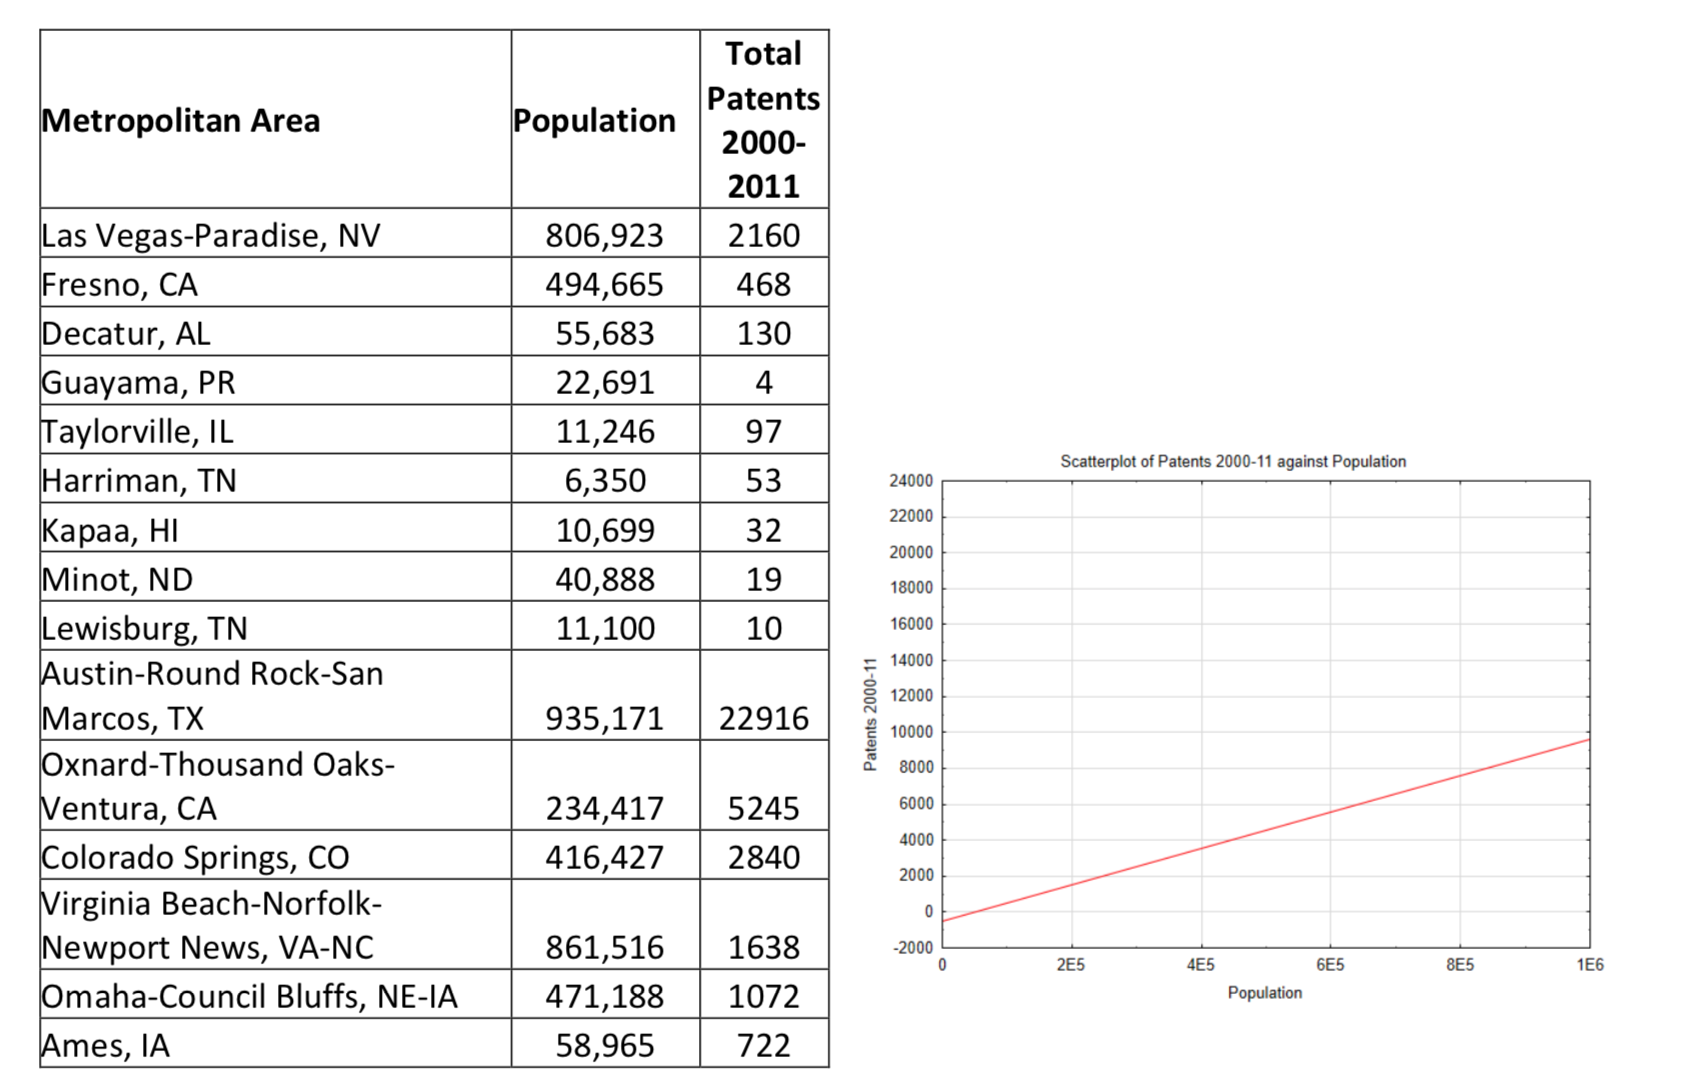
Show calculator outputs including the correlation, \(r^2\) value and equation of the regression line (which has been conveniently placed on the graph for you). Write a statistical conclusion then interpret the results. Use a level of significance of 0.10.
Correlation ____________
Coefficient of determination (\(r^2\) value) _______________
Regression equation _____________________
Hypothesis test concluding sentence:
Chapter 7 – \(\chi ^2\)
If a teacher changes the way a course is taught or uses a new book, how does the teacher know if the changes resulted in better success for the students? One way is to compare the distribution of grades (A, B, C, below C) to what has happened in past classes, assuming that assessments and grading were similar.
The distribution of grades for past classes that used the first edition of Foundations in Statistical Reasoning is shown in the middle column of the table below. The number of students who received each grade when using the second edition is shown below.
|
Grade |
Count from the second edition |
|
|
A |
0.349 |
16 |
|
B |
0.287 |
11 |
|
C |
0.204 |
7 |
|
Below C |
0.160 |
6 |
Test the hypothesis that the distribution of grades from the second edition is different than the distribution from the first edition.
Write the hypotheses:
\(H_0\):
\(H_1\):
Which test is appropriate for this problem?
A. _______ Goodness of Fit B. _______ Test for Independence C. _______ Test for Homogeneity
Test the hypothesis using the table below.
| Observed | Expected | \(O - E\) | \((O - E)^2\) | \(\dfrac{(O - E)^2}{E}\) |
| \(\chi^2 =\) |
Write a concluding sentence:
Which of the following conclusions does the evidence support?
_____The second edition resulted in a significantly improved distribution of grades
_____The second edition resulted in a significantly worsening of the distribution of grades
_____The second edition did not appear to affect the distribution of grades
This problem could be done a different way if you were told the number of people who got each grade using the first edition.
|
Grade |
Count from the first edition |
Count from the second edition |
A |
174 |
16 |
|
B |
143 |
11 |
|
C |
102 |
7 |
|
Below C |
80 |
6 |
Test the hypothesis that the distribution of grades from the second edition is different than the distribution from the first edition.
Write the hypotheses:
\(H_0:\)
\(H_1:\)
Which test is appropriate for this problem?
A. _______ Goodness of Fit B. _______ Test for Independence C. _______ Test for Homogeneity
Use the matrix and \(\chi^2\) test on your calculator to test the hypothesis.