6.6: Chapter 6 Exercises
- Page ID
- 26929

1. The waiting time for a bus is uniformly distributed between 0 and 15 minutes. What is the probability that a person has to wait at most 8 minutes for a bus?
2. The distance a golf ball travels when hit by a driver club is uniformly distributed between 200 and 300 feet. What is the probability that the ball hit by a driver club with travel at least 280 feet?
3. The time it takes me to wash the dishes is uniformly distributed between 7 minutes and 16 minutes. What is the probability that washing dishes tonight will take me between 9 and 14 minutes?
4. Bus wait times are uniformly distributed between 5 minutes and 18 minutes. Compute the probability that a randomly selected bus wait time will be between 9 and 13 minutes.
5. The lengths of an instructor’s classes have a continuous uniform distribution between 60 and 90 minutes. If one such class is randomly selected, find the probability that the class length is less than 70.7 minutes.
6. The time it takes for students to finish an exam is uniformly distributed between 1 to 2 hours. What is the probability that a randomly selected students finishes their exam in at least 95 minutes?
7. Suppose the commuter trains of a public transit system have a waiting time during peak rush hour periods of fifteen minutes. Assume the waiting times are uniformly distributed. Find the probability of waiting between 7 and 8 minutes.
8. Suppose that elementary students' ages are uniformly distributed from 5 to 13 years old. Compute the probability that a randomly selected elementary student will be between ages 7.07 and 10.33 years old.
9. The amount of gasoline sold daily at a service station is uniformly distributed with a minimum of 2,000 gallons and a maximum of 5,000 gallons.
a) Compute the probability that the service station will sell at least 4,000 gallons?
b) Compute the probability that daily sales will fall between 2,500 and 3,000 gallons?
c) What is the probability that the station will sell exactly 2,500 gallons?
10. The sojourn time (waiting time plus service time) for customers waiting at a movie theater box office is exponentially distributed with a mean of 4 minutes. Find the following.
a) The probability that the sojourn time will be more than 5 minutes.
b) The probability that the sojourn time will be less than 5 minutes.
c) The probability that the sojourn time will be at most 5 minutes.
11. Suppose that the distance, in miles, that people are willing to commute to work is exponentially distributed with mean 24 miles. What is the probability that people are willing to commute at most 12 miles to work?
12. On average, a pair of running shoes lasts 13 months if used every day. The length of time running shoes last is exponentially distributed. What is the probability that a pair of running shoes last less than 6 months if used every day?
13. The lifetime of a light emitting diode (LED) lightbulb is exponentially distributed with an average lifetime of 5,000 hours. Find the following.
a) The probability that the LED lightbulb will last more than 3,500 hours.
b) The probability that the LED lightbulb will last less than 4,000 hours.
c) The probability that the LED lightbulb will last between 3,500 and 4,500 hours.
14. The number of days ahead travelers purchase their airline tickets can be modeled by an exponential distribution with the average amount of time equal to 50 days.
a) Compute the probability that a traveler purchases a ticket no more than 85 days ahead of time.
b) Compute the probability that a traveler purchases a ticket more than 90 days ahead of time.
c) Compute the probability that a traveler purchases a ticket within 85 and 90 days ahead of the flight date.
15. The average time it takes a salesperson to finish a sale on the phone is 5 minutes and is exponentially distributed.
a) Compute the probability that less than 10 minutes pass before a sale is completed.
b) Compute the probability that more than 15 minutes pass before a sale is completed.
c) Compute the probability that between 10 and 15 minutes pass before a sale is completed.
16. A brand of battery is advertised to last 3 years. Assume the advertised claim is true and that the time the battery lasts is exponentially distributed. What is the probability that one of these batteries will last within 15 months of the advertised average?
17. For a standard normal distribution, find the following probabilities.
a) P(Z > -2.06)
b) P(-2.83 < Z < 0.21)
c) P(Z < 1.58) d) P(Z ≥ 1.69)
e) P(Z < -2.82)
f) P(Z > 2.14)
g) P(1.97 ≤ Z ≤ 2.93)
h) P(Z ≤ -0.51)
18. Compute the following probabilities where Z ~ N(0,1).
a) P(Z < 1.57)
b) P(Z > -1.24)
c) P(-1.96 ≤ Z ≤ 1.96)
d) P(Z ≤ 3)
e) P(1.31 < Z < 2.15)
f) P(Z ≥ 1.8)
19. Compute the following probabilities where Z ~ N(0,1).
a) P(Z ≤ -2.03)
b) P(Z > 1.58)
c) P(-1.645 ≤ Z ≤ 1.645)
d) P(Z < 2)
e) P(-2.38 < Z < -1.12)
f) P(Z ≥ -1.75)
20. Compute the area under the standard normal distribution to the left of z = -1.05.
21. Compute the area under the standard normal distribution to the left of z = -0.69.
22. Compute the area under the standard normal distribution to the right of z = 2.08.
23. Compute the area under the standard normal distribution to the right of z = 1.22.
24. Compute the area under the standard normal distribution between z = -0.29 and z = 0.14.
25. Compute the area under the standard normal distribution between z = -2.97 and z = -2.14.
26. Compute the area under the curve of the standard normal distribution that is within 1.328 standard deviations from either side of the mean.
27. Compute the area under the standard normal distribution to the left of z = 0.85.
28. Compute the z-score that has an area of 0.85 to the left of the z-score.
29. For the standard normal distribution, find the z-score that gives the 29th percentile.
30. For the standard normal distribution, find the z-score that gives the 75th percentile.
31. Compute the two z-scores that give the middle 99% of the standard normal distribution.
32. Compute the two z-scores that give the middle 95% of the standard normal distribution.
33. Find the IQR for the standard normal distribution.
34. The length of a human pregnancy is normally distributed with a mean of 272 days with a standard deviation of 9 days (Bhat & Kushtagi, 2006).
a) Compute the probability that a pregnancy lasts longer than 281 days.
b) Compute the probability that a pregnancy lasts less than 250 days.
c) How many days would a pregnancy last for the shortest 20%?
35. Arm span is the physical measurement of the length of an individual's arms from fingertip to fingertip. A man’s arm span is approximately normally distributed with mean of 70 inches with a standard deviation of 4.5 inches.
a) Compute the probability that a randomly selected man has an arm span below 65 inches.
b) Compute the probability that a randomly selected man has an arm span between 60 and 72 inches.
c) Compute the length in inches of the 99th percentile for a man’s arm span.
36. The size of fish is very important to commercial fishing. A study conducted in 2012 found the length of Atlantic cod caught in nets in Karlskrona to have a mean of 49.9 cm and a standard deviation of 3.74 cm (Ovegard, Berndt & Lunneryd, 2012). Assume the length of fish is normally distributed.
a) Compute the probability that a cod is longer than 55 cm.
b) What is the length in cm of the longest 15% of Atlantic cod in this area?
37. A dishwasher has a mean life of 12 years with an estimated standard deviation of 1.25 years ("Appliance life expectancy," 2013). Assume the life of a dishwasher is normally distributed.
a) Compute the probability that a dishwasher will last less than 10 years.
b) Compute the probability that a dishwasher will last between 8 and 10 years.
c) Compute the number of years that the bottom 25% of dishwashers would last.
38. The price of a computer is normally distributed with a mean of $1400 and a standard deviation of $60.
a) What is the probability that a buyer paid less than $1220?
b) What is the probability that a buyer paid between $1400 and $1580?
c) What is the probability that a buyer paid more than $1520?
d) What is the probability that a buyer paid between $1340 and $1460?
e) What is the probability that a buyer paid between $1400 and $1520?
f) What is the probability that a buyer paid between $1400 and $1460?
39. Heights of 10-year-old children, regardless of sex, closely follow a normal distribution with mean 55.7 inches and standard deviation 6.8 inches.
a) Compute the probability that a randomly chosen 10-year-old child is less than 50.4 inches.
b) Compute the probability that a randomly chosen 10-year-old child is more than 59.2 inches.
c) What proportion of 10-year-old children are between 50.4 and 61.5 inches tall?
d) Compute the 85th percentile for 10-year-old children.
40. The mean yearly rainfall in Sydney, Australia, is about 137 mm and the standard deviation is about 69 mm ("Annual maximums of," 2013). Assume rainfall is normally distributed. How many yearly mm of rainfall would there be in the top 25%?
41. The mean daily milk production of a herd of cows is assumed to be normally distributed with a mean of 33 liters, and standard deviation of 10.3 liters. Compute the probability that daily production is more than 40.9 liters?
42. The amount of time to complete a physical activity in a PE class is normally distributed with a mean of 33.2 seconds and a standard deviation of 5.8 seconds. Round answers to 4 decimal places.
a) What is the probability that a randomly chosen student completes the activity in less than 28.9 seconds?
b) What is the probability that a randomly chosen student completes the activity in more than 37.2 seconds?
c) What proportion of students take between 28.5 and 37.3 seconds to complete the activity? d) 70% of all students finish the activity in less than _____ seconds.
43. A study was conducted on students from a particular high school over the last 8 years. The following information was found regarding standardized tests used for college admittance. Scores on the SAT test are normally distributed with a mean of 1023 and a standard deviation of 204. Scores on the ACT test are normally distributed with a mean of 19.3 and a standard deviation of 5.2. It is assumed that the two tests measure the same aptitude, but use different scales.
a) Compute the SAT score that is the 50-percentile.
b) Compute the ACT score that is the 50-percentile.
c) If a student gets an SAT score of 1288, find their equivalent ACT score. Go out at least 5 decimal places between steps.
44. Delivery times for shipments from a central warehouse are exponentially distributed with a mean of 1.73 days (note that times are measured continuously, not just in number of days). The standard deviation of an exponential distribution is equal to the mean of 1.73 days. A random sample of 108 shipments are selected and their shipping times are observed. Use the Central Limit Theorem to find the probability that the mean shipping time for the 108 shipments is less than 1.53 days.
45. The MAX light rail in Portland, OR has a waiting time that is uniformly distributed with a mean waiting time of 5 minutes with a standard deviation of 2.9 minutes. A random sample of 40 wait times was selected. What is the probability the sample mean wait time is under 4 minutes?
46. The average credit card debt back in 2016 was $16,061 with a standard deviation of $4100. What is the probability that a sample of 35 people owe a mean of more than $18,000?
47. A certain brand of electric bulbs has an average life of 300 hours with a standard deviation of 45. A random sample of 100 bulbs is tested. What is the probability that the sample mean will be less than 295?
48. Assume that the birth weights of babies are normally distributed with a mean of 3363 grams and a standard deviation of 563 grams.
a) Compute the probability that a randomly selected baby weighs between 3200 grams and 3600 grams.
b) Compute the probability that the average weight of 30 randomly selected babies is between 3200 grams and 3600 grams.
c) Why did the probability increase?
49. If the Central Limit Theorem is applicable, this means that the sampling distribution of a __________ population can be treated as normal since the __________ is __________.
a) symmetrical; variance; large
b) positively skewed; sample size; small
c) negatively skewed; standard deviation; large
d) non-normal; mean; large
e) negatively skewed; sample size; large
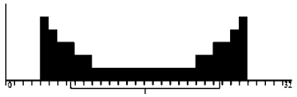
50. Match the following 3 graphs with the distribution of the population, the distribution of the sample, and the sampling distribution.
a) Distribution of the Population
b) Distribution of the Sample
c) Sampling Distribution
i. 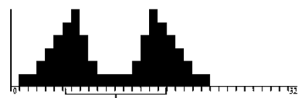
ii. 
iii. 
51. Match the following 3 graphs with the distribution of the population, the distribution of the sample, and the sampling distribution.
a) Distribution of the Population
b) Distribution of the Sample
c) Sampling Distribution
i. 
ii. 
iii. 
52. Match the following 3 graphs with the distribution of the population, the distribution of the sample, and the sampling distribution.
a) Distribution of the Population
b) Distribution of the Sample
c) Sampling Distribution
i. 
ii. 
iii.