10.9: The p‐value- Misconceptions and Proper Usage
- Page ID
- 20912

One of the most misinterpreted concepts in Statistics is the p‐value. In government studies and scientific research, there have been invalid conclusion based on misinterpreting the \(p\)‐value. On March 7, 2016, in an unprecedented statement, the American Statistical Association released a paper, "Statement on Statistical Significance and P‐Values", which offered principles to improve the conduct and interpretation of quantitative science.77
The paper introduced 6 standards, which we will review individually.
- \(P\)‐values can indicate how incompatible the data are with a specified statistical model.
The \(p\)‐value is the probability of getting data this extreme given \(H_o\) is true. This is a conditional probability and can be written as:
\(p\)‐value=\(P\)(getting this data or more extreme data | \(H_o\) is true)
Example: Financial aid
A researcher wanted to show that the percentage of students at community colleges who receive financial aid exceeds 40%.
Solution
\(H_o: p = 0.40\) (The proportion of community college students receiving financial aid is 0.40.).
\(H_a: p > 0.40\) (The proportion of community college students receiving financial aid is over 0.40.).
The research sampled 874 students and found that 376 of them received financial aid. This works to a sample proportion \(\hat{p}=0.430\), which leads to a \(Z\) value of 1.822, if \(p = 0.40\).
\(\begin{aligned}
p \text {-value }=& P(\hat{p}>0.430 \mid H_o \text { is true }) \\
&=P(Z>1.822)\\&=0.034
\end{aligned} \)
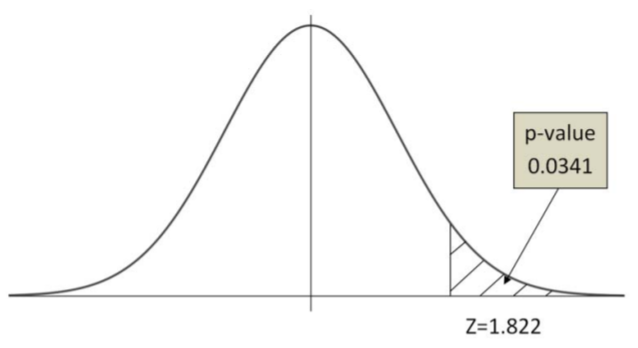
The probability of getting this sample proportion, or something larger given the actual proportion is 0.40 is equal 0.034.
- \(P\)‐values do not measure the probability that the studied hypothesis is true, or the probability that the data were produced by random chance alone.
After conducting an experiment, researchers would love to be able know the probability that their claim is true. Unfortunately, this probability cannot be calculated from the \(p\)‐value alone.
Example: Financial aid
Let's return to the researcher who wanted to show that the percentage of students at community colleges who receive financial aid exceeds 40%. After conducting the research, the p‐value was 0.034. Suppose the researcher wrote this conclusion:
"With 96.6% confidence, we conclude that the percentage of community college students who receive financial aid exceeds 40%”.
This conclusion is invalid, and conclusions written with a similar misinterpretation has shown up in many published works. Let's explore the problem here.
The researcher is claiming that the probability that the alternative hypothesis is true is the complement of the \(p\)‐value. In other words, the researcher is claiming the \(p\)‐value is the probability \(H_o\) is true given this data. This researcher has flipped the conditionality in the \(p\)‐value definition!
Researcher's misinterpretation: \(p\)‐value = \(P\)( \(H_o\) is true | Data this Extreme)
Correct interpretation of \(p\)‐value = \(P\)( Getting Data this Extreme | \(H_o\) is true)
In Chapter 5 on probability, we explored why \(P(A|B)\) is not the same as \(P(B|A)\).
Recall the testing for HIV example from Chapter 5
\(P\)(Tests + | HIV‐) = 1350/9000 = 85%
\(P\)(HIV+ | Tests+) = 950/2300 = 41.3%
Even though the test has a true‐positive rate of 85%, there is only a 41% chance that someone who tests positive has HIV.
| HIV+ A | HIV- A' | Total | |
|---|---|---|---|
| Test+ B | 950 | 1350 | 2300 |
| Test- B' | 50 | 7650 | 7700 |
| Total | 1000 | 9000 | 10000 |
- Scientific conclusions and business or policy decisions should not be based only on whether a \(p\)‐ value passes a specific threshold.
In any statistics course, we learn that having a \(p\)‐value less than the significance level is evidence supporting the Alternative Hypothesis. This does not necessarily mean \(H_a\) is true or even probably true. There needs to be other reasoning as to why \(H_a\) might be true.
Some research journals, like Basic and Applied Social Psychology, now require research show “strong descriptive statistics, including effect sizes.”78
Example: Financial aid
We will again return to financial aid example. After conducting the research, the \(p\)‐value was 0.031. If we started with a significance level of 5%, the decision would be to Reject \(H_o\) and support the claim that the percentage of students at community colleges who receive financial aid exceeds 40%. However, if we started with a significance level of 1%, the decision would be to Fail to Reject \(H_o\) and there would not be enough evidence to support the claim that the percentage of students at community colleges who receive financial aid exceeds 40%. Even if \(H_o\) is rejected, this evidence is not conclusive.
A significant result is only a piece of evidence, and there should always be additional criteria in decision making and research.
- Proper inference requires full reporting and transparency.
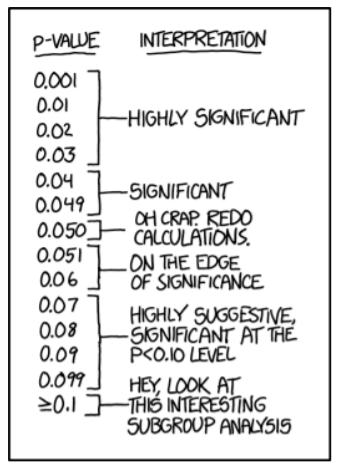
Before conducting research and before collecting data, the experiment needs to be designed and hypotheses need to be stated. Often, especially with a dramatic increase in access to “Big Data”, some have used data dredging as a way to look at many possibilities and identify phenomena that are significant. Researchers, in a desire to get published, will cheat the science by using techniques called \(p\)‐hacking.
Methods of \(p\)‐hacking
- Collecting data until the \(p\)‐value < \(\alpha\), then stop collecting data.
- Analyzing many options or conditions, but only publishing ones that are significant.
- Cherry picking the data to only include values that support the claim.
- Only looking at subgroups that are significant.
Use of these \(p\)‐hacking methods are troubling and is one of the main reasons scientific journals are now skeptical of \(p\)‐value based hypothesis testing.
The XKCD comic “Significant”79, pictured on the right, shows an example of \(p\)‐hacking, including how the media misinterprets research.


- A \(p\)‐value, or statistical significance, does not measure the size of an effect or the importance of a result.
A result may be statistically significant, but have no practical value.
Suppose someone claims that the mean flying time between New York and San Francisco is 6 hours 20 minutes. After conducting a large sample size study, you find significant evidence (\(p\)‐value < .01) that the mean flying time is really longer, with a sample mean of 6 hours and 23 minutes.
Even though your evidence is strong, there is no practical difference between the times. The \(p\)‐value does not address effect sizes.
- By itself, a \(p\)‐value does not provide a good measure of evidence regarding a model or hypothesis.
The \(p\)‐value is a useful tool, but by itself is not enough to support research.80