
20.5: Time series
- Page ID
- 45278

\( \newcommand{\vecs}[1]{\overset { \scriptstyle \rightharpoonup} {\mathbf{#1}} } \)
\( \newcommand{\vecd}[1]{\overset{-\!-\!\rightharpoonup}{\vphantom{a}\smash {#1}}} \)
\( \newcommand{\dsum}{\displaystyle\sum\limits} \)
\( \newcommand{\dint}{\displaystyle\int\limits} \)
\( \newcommand{\dlim}{\displaystyle\lim\limits} \)
\( \newcommand{\id}{\mathrm{id}}\) \( \newcommand{\Span}{\mathrm{span}}\)
( \newcommand{\kernel}{\mathrm{null}\,}\) \( \newcommand{\range}{\mathrm{range}\,}\)
\( \newcommand{\RealPart}{\mathrm{Re}}\) \( \newcommand{\ImaginaryPart}{\mathrm{Im}}\)
\( \newcommand{\Argument}{\mathrm{Arg}}\) \( \newcommand{\norm}[1]{\| #1 \|}\)
\( \newcommand{\inner}[2]{\langle #1, #2 \rangle}\)
\( \newcommand{\Span}{\mathrm{span}}\)
\( \newcommand{\id}{\mathrm{id}}\)
\( \newcommand{\Span}{\mathrm{span}}\)
\( \newcommand{\kernel}{\mathrm{null}\,}\)
\( \newcommand{\range}{\mathrm{range}\,}\)
\( \newcommand{\RealPart}{\mathrm{Re}}\)
\( \newcommand{\ImaginaryPart}{\mathrm{Im}}\)
\( \newcommand{\Argument}{\mathrm{Arg}}\)
\( \newcommand{\norm}[1]{\| #1 \|}\)
\( \newcommand{\inner}[2]{\langle #1, #2 \rangle}\)
\( \newcommand{\Span}{\mathrm{span}}\) \( \newcommand{\AA}{\unicode[.8,0]{x212B}}\)
\( \newcommand{\vectorA}[1]{\vec{#1}} % arrow\)
\( \newcommand{\vectorAt}[1]{\vec{\text{#1}}} % arrow\)
\( \newcommand{\vectorB}[1]{\overset { \scriptstyle \rightharpoonup} {\mathbf{#1}} } \)
\( \newcommand{\vectorC}[1]{\textbf{#1}} \)
\( \newcommand{\vectorD}[1]{\overrightarrow{#1}} \)
\( \newcommand{\vectorDt}[1]{\overrightarrow{\text{#1}}} \)
\( \newcommand{\vectE}[1]{\overset{-\!-\!\rightharpoonup}{\vphantom{a}\smash{\mathbf {#1}}}} \)
\( \newcommand{\vecs}[1]{\overset { \scriptstyle \rightharpoonup} {\mathbf{#1}} } \)
\(\newcommand{\longvect}{\overrightarrow}\)
\( \newcommand{\vecd}[1]{\overset{-\!-\!\rightharpoonup}{\vphantom{a}\smash {#1}}} \)
\(\newcommand{\avec}{\mathbf a}\) \(\newcommand{\bvec}{\mathbf b}\) \(\newcommand{\cvec}{\mathbf c}\) \(\newcommand{\dvec}{\mathbf d}\) \(\newcommand{\dtil}{\widetilde{\mathbf d}}\) \(\newcommand{\evec}{\mathbf e}\) \(\newcommand{\fvec}{\mathbf f}\) \(\newcommand{\nvec}{\mathbf n}\) \(\newcommand{\pvec}{\mathbf p}\) \(\newcommand{\qvec}{\mathbf q}\) \(\newcommand{\svec}{\mathbf s}\) \(\newcommand{\tvec}{\mathbf t}\) \(\newcommand{\uvec}{\mathbf u}\) \(\newcommand{\vvec}{\mathbf v}\) \(\newcommand{\wvec}{\mathbf w}\) \(\newcommand{\xvec}{\mathbf x}\) \(\newcommand{\yvec}{\mathbf y}\) \(\newcommand{\zvec}{\mathbf z}\) \(\newcommand{\rvec}{\mathbf r}\) \(\newcommand{\mvec}{\mathbf m}\) \(\newcommand{\zerovec}{\mathbf 0}\) \(\newcommand{\onevec}{\mathbf 1}\) \(\newcommand{\real}{\mathbb R}\) \(\newcommand{\twovec}[2]{\left[\begin{array}{r}#1 \\ #2 \end{array}\right]}\) \(\newcommand{\ctwovec}[2]{\left[\begin{array}{c}#1 \\ #2 \end{array}\right]}\) \(\newcommand{\threevec}[3]{\left[\begin{array}{r}#1 \\ #2 \\ #3 \end{array}\right]}\) \(\newcommand{\cthreevec}[3]{\left[\begin{array}{c}#1 \\ #2 \\ #3 \end{array}\right]}\) \(\newcommand{\fourvec}[4]{\left[\begin{array}{r}#1 \\ #2 \\ #3 \\ #4 \end{array}\right]}\) \(\newcommand{\cfourvec}[4]{\left[\begin{array}{c}#1 \\ #2 \\ #3 \\ #4 \end{array}\right]}\) \(\newcommand{\fivevec}[5]{\left[\begin{array}{r}#1 \\ #2 \\ #3 \\ #4 \\ #5 \\ \end{array}\right]}\) \(\newcommand{\cfivevec}[5]{\left[\begin{array}{c}#1 \\ #2 \\ #3 \\ #4 \\ #5 \\ \end{array}\right]}\) \(\newcommand{\mattwo}[4]{\left[\begin{array}{rr}#1 \amp #2 \\ #3 \amp #4 \\ \end{array}\right]}\) \(\newcommand{\laspan}[1]{\text{Span}\{#1\}}\) \(\newcommand{\bcal}{\cal B}\) \(\newcommand{\ccal}{\cal C}\) \(\newcommand{\scal}{\cal S}\) \(\newcommand{\wcal}{\cal W}\) \(\newcommand{\ecal}{\cal E}\) \(\newcommand{\coords}[2]{\left\{#1\right\}_{#2}}\) \(\newcommand{\gray}[1]{\color{gray}{#1}}\) \(\newcommand{\lgray}[1]{\color{lightgray}{#1}}\) \(\newcommand{\rank}{\operatorname{rank}}\) \(\newcommand{\row}{\text{Row}}\) \(\newcommand{\col}{\text{Col}}\) \(\renewcommand{\row}{\text{Row}}\) \(\newcommand{\nul}{\text{Nul}}\) \(\newcommand{\var}{\text{Var}}\) \(\newcommand{\corr}{\text{corr}}\) \(\newcommand{\len}[1]{\left|#1\right|}\) \(\newcommand{\bbar}{\overline{\bvec}}\) \(\newcommand{\bhat}{\widehat{\bvec}}\) \(\newcommand{\bperp}{\bvec^\perp}\) \(\newcommand{\xhat}{\widehat{\xvec}}\) \(\newcommand{\vhat}{\widehat{\vvec}}\) \(\newcommand{\uhat}{\widehat{\uvec}}\) \(\newcommand{\what}{\widehat{\wvec}}\) \(\newcommand{\Sighat}{\widehat{\Sigma}}\) \(\newcommand{\lt}{<}\) \(\newcommand{\gt}{>}\) \(\newcommand{\amp}{&}\) \(\definecolor{fillinmathshade}{gray}{0.9}\)Introduction
Time series refer to any measure recorded over time. Stationary time series do not have trends or seasonality, just random (white) noise; differencing time series do have trends and or seasonality. Stationary time series will not have predictable patterns over the long term.
This page is under construction. Examples and questions are in place, but not much else; here’s a resource on time series:
http://www.itl.nist.gov/div898/handbook/pmc/section4/pmc4.htm
R code
To conduct time series analysis use built in functions like ts() and decompose(). HoltWinters() also useful, now part of stats. Lots of specialized time series packages with advanced features, including forecast, timeSeries (Financial time series), season (Seasonal analysis of health data), and many others.
Note 1: Caution — newer versions of R have HoltWinters() and related functions included with base package stats.
Note 2: Rcmdr package for time series was RcmdrPlugin.epack , no longer available as of 2018.
For up-to-date listing of time series packages, see https://cran.r-project.org/web/views/TimeSeries.html
Time series data sets included in R and Rcmdr
R Code:
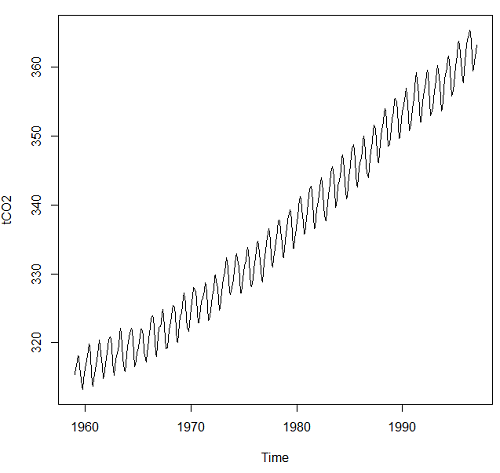
data(co2, package="datasets")
co2 <- as.data.frame(co2)
#convert to time series data type with ts()
tCO2 <- ts(co2,frequency=12,start=c(1959),end=c(1997))
plot.ts(tCO2)
Other datasets included with R
carData::Arrests
carData::Bfox
carData::CanPop
Note: Dr D needs to complete this list
Example
Get up-to-date CO2 data from NOAA as text file. Download to your computer, load and clean in your favorite spreadsheet app. Months came as numbers 1,2,3, etc., I changed to text, Jan, Feb, Mar, etc. I grabbed three columns: year, month, ppm for import to R.
head(maunaLoa)
R output:
> head(maunaLoa)
  year month  ppm
1 1958 Mar 315.70
2 1958 Apr 317.45
3 1958 May 317.51
4 1958 Jun 317.24
5 1958 Jul 315.86
6 1958 Aug 314.93
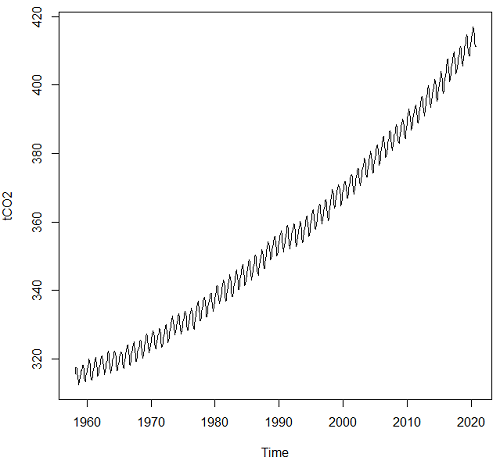
However, it turns out the time series functions are easiest to work if only the ppm data are included.
tCO2 <- ts(maunaLoa[,"ppm"],frequency=12,start=c(1958,3),end=c(2020,10))
head(tCO2)
R output:
> head(tCO2)
        Mar    Apr    May    Jun    Jul    Aug
1958 315.70 317.45 317.51 317.24 315.86 314.93
Get our plot (Figure \(\PageIndex{2}\)).
plot(tCO2)
Seasonal time series come with a trend component, a seasonal component, and a random component.
R code:
dectCO2 <- decompose(tCO2)
head(dectCO2)
plot(dectCO2)

Forecasting
Excellent resource at https://otexts.com/fpp2/
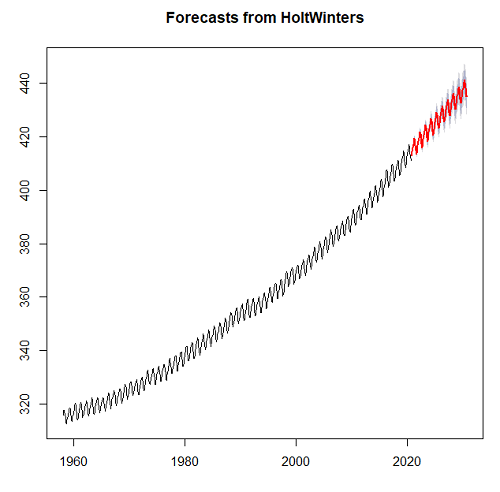
Exponential smoothing, weighted averages of past observations, weighted so that more recent observations are more influential.
Holt-Winters method extracts seasonal component (additive or multiplicative).
#set start value to value of first observation
tCO2cast <- HoltWinters(tCO2, l.start=315.42)
#Predict for next ten years. Because frequency in ts() was monthly, ten years is h=120
forecastCO2 <- forecast(tCO2cast, h=120)
plot(forecastCO2, fcol="red")
ARIMA models
DrD needs to complete
Questions
- If a time series data set obtains observations collected at yearly intervals, what value should you enter in
ts()function for frequency? - For the CO2 dataset included in Rcmdr (co2, datasets), obtain forecast for year 2020 and compare against actual 2020 data (see Figure \(\PageIndex{2}\)).
- Positive clinical samples between September 2015 and November 2020 for flu virus in the USA are provided in the data set below (scroll or click here). The frequency of observations was weekly. Apply
decompose()and obtain the seasonal and trend components of the data set. Which month does the peak positive sample occur? - Total pounds of fish (variable = Pounds) and pounds of Akule and Opelu (variable = Akule.Opelu) caught by commercial industry in Hawaii, from 2000 to 2018 are provided in the data set below (scroll or click here). Apply
decompose()and obtain the seasonal and trend components of the data set for Total pounds and again for Akule (Selar crumenophthalmus) and Opelu (Decapterus macarellus). Is there evidence for trends, and if so, describe the trend. Is there evidence of seasonality? If so, which month did peak fishing occur?
Flu data set this page
Flu, extracted 28 Nov 2020 from https://gis.cdc.gov/grasp/fluview/fluportaldashboard.html
| Year | Date | Week | Positive |
| 2015 | 09/28/15 | 40 | 1.05578 |
| 2015 | 10/05/15 | 41 | 1.29662 |
| 2015 | 10/12/15 | 42 | 1.10855 |
| 2015 | 10/19/15 | 43 | 1.10807 |
| 2015 | 10/26/15 | 44 | 1.12344 |
| 2015 | 11/02/15 | 45 | 1.38224 |
| 2015 | 11/09/15 | 46 | 1.19344 |
| 2015 | 11/16/15 | 47 | 1.38506 |
| 2015 | 11/23/15 | 48 | 1.39498 |
| 2015 | 11/30/15 | 49 | 1.47544 |
| 2015 | 12/07/15 | 50 | 2.51181 |
| 2015 | 12/14/15 | 51 | 2.287 |
| 2015 | 12/21/15 | 52 | 2.45958 |
| 2016 | 01/04/16 | 1 | 2.93137 |
| 2016 | 01/11/16 | 2 | 4.25384 |
| 2016 | 01/18/16 | 3 | 5.48463 |
| 2016 | 01/25/16 | 4 | 6.95974 |
| 2016 | 02/01/16 | 5 | 9.69858 |
| 2016 | 02/08/16 | 6 | 12.5491 |
| 2016 | 02/15/16 | 7 | 15.5359 |
| 2016 | 02/22/16 | 8 | 18.3621 |
| 2016 | 02/29/16 | 9 | 21.1098 |
| 2016 | 03/07/16 | 10 | 23.6454 |
| 2016 | 03/14/16 | 11 | 19.972 |
| 2016 | 03/21/16 | 12 | 18.4709 |
| 2016 | 03/28/16 | 13 | 16.2265 |
| 2016 | 04/04/16 | 14 | 14.0164 |
| 2016 | 04/11/16 | 15 | 13.2362 |
| 2016 | 04/18/16 | 16 | 12.3464 |
| 2016 | 04/25/16 | 17 | 10.2615 |
| 2016 | 05/02/16 | 18 | 8.12094 |
| 2016 | 05/09/16 | 19 | 6.68559 |
| 2016 | 05/16/16 | 20 | 5.81108 |
| 2016 | 05/23/16 | 21 | 4.71918 |
| 2016 | 05/30/16 | 22 | 3.0595 |
| 2016 | 06/06/16 | 23 | 3.02006 |
| 2016 | 06/13/16 | 24 | 1.82927 |
| 2016 | 06/20/16 | 25 | 1.71228 |
| 2016 | 06/27/16 | 26 | 1.22261 |
| 2016 | 07/04/16 | 27 | 0.903312 |
| 2016 | 07/11/16 | 28 | 0.869153 |
| 2016 | 07/18/16 | 29 | 0.849185 |
| 2016 | 07/25/16 | 30 | 0.781793 |
| 2016 | 08/01/16 | 31 | 0.933921 |
| 2016 | 08/08/16 | 32 | 0.900745 |
| 2016 | 08/15/16 | 33 | 0.803482 |
| 2016 | 08/22/16 | 34 | 1.40485 |
| 2016 | 08/29/16 | 35 | 1.67771 |
| 2016 | 09/05/16 | 36 | 1.46146 |
| 2016 | 09/12/16 | 37 | 1.51255 |
| 2016 | 09/19/16 | 38 | 1.74135 |
| 2016 | 09/26/16 | 39 | 1.78369 |
| 2016 | 10/03/16 | 40 | 1.56951 |
| 2016 | 10/10/16 | 41 | 1.35914 |
| 2016 | 10/17/16 | 42 | 1.40304 |
| 2016 | 10/24/16 | 43 | 1.50862 |
| 2016 | 10/31/16 | 44 | 1.91569 |
| 2016 | 11/07/16 | 45 | 2.20089 |
| 2016 | 11/14/16 | 46 | 2.57608 |
| 2016 | 11/21/16 | 47 | 3.34773 |
| 2016 | 11/28/16 | 48 | 3.3191 |
| 2016 | 12/05/16 | 49 | 4.25987 |
| 2016 | 12/12/16 | 50 | 6.68342 |
| 2016 | 12/19/16 | 51 | 10.7819 |
| 2016 | 12/26/16 | 52 | 13.9993 |
| 2017 | 01/02/17 | 1 | 13.3436 |
| 2017 | 01/09/17 | 2 | 15.373 |
| 2017 | 01/16/17 | 3 | 18.2865 |
| 2017 | 01/23/17 | 4 | 18.5299 |
| 2017 | 01/30/17 | 5 | 21.4215 |
| 2017 | 02/06/17 | 6 | 24.1525 |
| 2017 | 02/13/17 | 7 | 24.5117 |
| 2017 | 02/20/17 | 8 | 24.7251 |
| 2017 | 02/27/17 | 9 | 19.772 |
| 2017 | 03/06/17 | 10 | 19.2714 |
| 2017 | 03/13/17 | 11 | 19.0338 |
| 2017 | 03/20/17 | 12 | 19.7113 |
| 2017 | 03/27/17 | 13 | 18.4816 |
| 2017 | 04/03/17 | 14 | 15.4251 |
| 2017 | 04/10/17 | 15 | 12.7395 |
| 2017 | 04/17/17 | 16 | 9.69626 |
| 2017 | 04/24/17 | 17 | 6.76776 |
| 2017 | 05/01/17 | 18 | 5.91752 |
| 2017 | 05/08/17 | 19 | 5.33264 |
| 2017 | 05/15/17 | 20 | 4.86286 |
| 2017 | 05/22/17 | 21 | 4.35223 |
| 2017 | 05/29/17 | 22 | 4.16524 |
| 2017 | 06/05/17 | 23 | 3.38586 |
| 2017 | 06/12/17 | 24 | 3.06229 |
| 2017 | 06/19/17 | 25 | 2.64932 |
| 2017 | 06/26/17 | 26 | 2.53401 |
| 2017 | 07/03/17 | 27 | 2.17791 |
| 2017 | 07/10/17 | 28 | 2.16392 |
| 2017 | 07/17/17 | 29 | 1.83895 |
| 2017 | 07/24/17 | 30 | 1.80607 |
| 2017 | 07/31/17 | 31 | 1.94796 |
| 2017 | 08/07/17 | 32 | 1.90048 |
| 2017 | 08/14/17 | 33 | 1.34281 |
| 2017 | 08/21/17 | 34 | 1.43382 |
| 2017 | 08/28/17 | 35 | 1.93535 |
| 2017 | 09/04/17 | 36 | 1.88806 |
| 2017 | 09/11/17 | 37 | 1.89622 |
| 2017 | 09/18/17 | 38 | 1.66942 |
| 2017 | 09/25/17 | 39 | 1.70313 |
| 2017 | 10/02/17 | 40 | 2.20191 |
| 2017 | 10/09/17 | 41 | 2.08975 |
| 2017 | 10/16/17 | 42 | 2.17647 |
| 2017 | 10/23/17 | 43 | 2.58279 |
| 2017 | 10/30/17 | 44 | 3.60729 |
| 2017 | 11/06/17 | 45 | 4.24472 |
| 2017 | 11/13/17 | 46 | 5.29966 |
| 2017 | 11/20/17 | 47 | 7.0877 |
| 2017 | 11/27/17 | 48 | 7.30533 |
| 2017 | 12/04/17 | 49 | 10.7453 |
| 2017 | 12/11/17 | 50 | 15.3549 |
| 2017 | 12/18/17 | 51 | 22.777 |
| 2017 | 12/25/17 | 52 | 25.3864 |
| 2018 | 01/01/18 | 1 | 25.3653 |
| 2018 | 01/08/18 | 2 | 26.9421 |
| 2018 | 01/15/18 | 3 | 27.034 |
| 2018 | 01/22/18 | 4 | 27.3698 |
| 2018 | 01/29/18 | 5 | 27.0643 |
| 2018 | 02/05/18 | 6 | 26.9981 |
| 2018 | 02/12/18 | 7 | 26.1174 |
| 2018 | 02/19/18 | 8 | 22.6155 |
| 2018 | 02/26/18 | 9 | 18.4867 |
| 2018 | 03/05/18 | 10 | 15.6938 |
| 2018 | 03/12/18 | 11 | 15.5813 |
| 2018 | 03/19/18 | 12 | 15.328 |
| 2018 | 03/26/18 | 13 | 15.1135 |
| 2018 | 04/02/18 | 14 | 12.6888 |
| 2018 | 04/09/18 | 15 | 11.2486 |
| 2018 | 04/16/18 | 16 | 9.39813 |
| 2018 | 04/23/18 | 17 | 7.99876 |
| 2018 | 04/30/18 | 18 | 6.25914 |
| 2018 | 05/07/18 | 19 | 4.39311 |
| 2018 | 05/14/18 | 20 | 3.16606 |
| 2018 | 05/21/18 | 21 | 2.39003 |
| 2018 | 05/28/18 | 22 | 1.52934 |
| 2018 | 06/04/18 | 23 | 1.57683 |
| 2018 | 06/11/18 | 24 | 1.29914 |
| 2018 | 06/18/18 | 25 | 1.02329 |
| 2018 | 06/25/18 | 26 | 1.11356 |
| 2018 | 07/02/18 | 27 | 1.00305 |
| 2018 | 07/09/18 | 28 | 0.916118 |
| 2018 | 07/16/18 | 29 | 1.0534 |
| 2018 | 07/23/18 | 30 | 0.995099 |
| 2018 | 07/30/18 | 31 | 0.953592 |
| 2018 | 08/06/18 | 32 | 0.95729 |
| 2018 | 08/13/18 | 33 | 0.764331 |
| 2018 | 08/20/18 | 34 | 1.33625 |
| 2018 | 08/27/18 | 35 | 1.50367 |
| 2018 | 09/03/18 | 36 | 1.74739 |
| 2018 | 09/10/18 | 37 | 1.68745 |
| 2018 | 09/17/18 | 38 | 1.69929 |
| 2018 | 09/24/18 | 39 | 1.49699 |
| 2018 | 10/01/18 | 40 | 1.74855 |
| 2018 | 10/08/18 | 41 | 1.6967 |
| 2018 | 10/15/18 | 42 | 1.99298 |
| 2018 | 10/22/18 | 43 | 2.05527 |
| 2018 | 10/29/18 | 44 | 2.17372 |
| 2018 | 11/05/18 | 45 | 2.7331 |
| 2018 | 11/12/18 | 46 | 3.15674 |
| 2018 | 11/19/18 | 47 | 3.92782 |
| 2018 | 11/26/18 | 48 | 3.91485 |
| 2018 | 12/03/18 | 49 | 6.23152 |
| 2018 | 12/10/18 | 50 | 10.3644 |
| 2018 | 12/17/18 | 51 | 14.2649 |
| 2018 | 12/24/18 | 52 | 16.352 |
| 2019 | 12/31/18 | 1 | 12.1387 |
| 2019 | 01/07/19 | 2 | 12.7217 |
| 2019 | 01/14/19 | 3 | 16.3174 |
| 2019 | 01/21/19 | 4 | 19.3918 |
| 2019 | 01/28/19 | 5 | 22.5493 |
| 2019 | 02/04/19 | 6 | 25.1342 |
| 2019 | 02/11/19 | 7 | 26.026 |
| 2019 | 02/18/19 | 8 | 26.2407 |
| 2019 | 02/25/19 | 9 | 26.0743 |
| 2019 | 03/04/19 | 10 | 25.6065 |
| 2019 | 03/11/19 | 11 | 26.1318 |
| 2019 | 03/18/19 | 12 | 22.4805 |
| 2019 | 03/25/19 | 13 | 19.3035 |
| 2019 | 04/01/19 | 14 | 14.9422 |
| 2019 | 04/08/19 | 15 | 11.9093 |
| 2019 | 04/15/19 | 16 | 8.61102 |
| 2019 | 04/22/19 | 17 | 5.84355 |
| 2019 | 04/29/19 | 18 | 4.81976 |
| 2019 | 05/06/19 | 19 | 3.83986 |
| 2019 | 05/13/19 | 20 | 3.54159 |
| 2019 | 05/20/19 | 21 | 3.41968 |
| 2019 | 05/27/19 | 22 | 3.0826 |
| 2019 | 06/03/19 | 23 | 2.78989 |
| 2019 | 06/10/19 | 24 | 2.31579 |
| 2019 | 06/17/19 | 25 | 1.90194 |
| 2019 | 06/24/19 | 26 | 2.0806 |
| 2019 | 07/01/19 | 27 | 2.42883 |
| 2019 | 07/08/19 | 28 | 2.01653 |
| 2019 | 07/15/19 | 29 | 2.21849 |
| 2019 | 07/22/19 | 30 | 2.37706 |
| 2019 | 07/29/19 | 31 | 2.39817 |
| 2019 | 08/05/19 | 32 | 2.05446 |
| 2019 | 08/12/19 | 33 | 2.08183 |
| 2019 | 08/19/19 | 34 | 2.36167 |
| 2019 | 08/26/19 | 35 | 3.45517 |
| 2019 | 09/02/19 | 36 | 3.09749 |
| 2019 | 09/09/19 | 37 | 2.48391 |
| 2019 | 09/16/19 | 38 | 2.75656 |
| 2019 | 09/23/19 | 39 | 2.74367 |
| 2019 | 09/30/19 | 40 | 1.30976 |
| 2019 | 10/07/19 | 41 | 1.47877 |
| 2019 | 10/14/19 | 42 | 1.55203 |
| 2019 | 10/21/19 | 43 | 2.25335 |
| 2019 | 10/28/19 | 44 | 3.05701 |
| 2019 | 11/04/19 | 45 | 5.16261 |
| 2019 | 11/11/19 | 46 | 6.75594 |
| 2019 | 11/18/19 | 47 | 9.54599 |
| 2019 | 11/25/19 | 48 | 10.9385 |
| 2019 | 12/02/19 | 49 | 11.6554 |
| 2019 | 12/09/19 | 50 | 16.1542 |
| 2019 | 12/16/19 | 51 | 22.533 |
| 2019 | 12/23/19 | 52 | 26.9336 |
| 2020 | 12/30/19 | 1 | 23.4883 |
| 2020 | 01/06/20 | 2 | 23.1187 |
| 2020 | 01/13/20 | 3 | 26.0826 |
| 2020 | 01/20/20 | 4 | 28.2813 |
| 2020 | 01/27/20 | 5 | 30.1465 |
| 2020 | 02/03/20 | 6 | 30.2596 |
| 2020 | 02/10/20 | 7 | 29.675 |
| 2020 | 02/17/20 | 8 | 28.3215 |
| 2020 | 02/24/20 | 9 | 25.7517 |
| 2020 | 03/02/20 | 10 | 22.4914 |
| 2020 | 03/09/20 | 11 | 15.8125 |
| 2020 | 03/16/20 | 12 | 7.50171 |
| 2020 | 03/23/20 | 13 | 2.32158 |
| 2020 | 03/30/20 | 14 | 1.0312 |
| 2020 | 04/06/20 | 15 | 0.61823 |
| 2020 | 04/13/20 | 16 | 0.623139 |
| 2020 | 04/20/20 | 17 | 0.218375 |
| 2020 | 04/27/20 | 18 | 0.262953 |
| 2020 | 05/04/20 | 19 | 0.326173 |
| 2020 | 05/11/20 | 20 | 0.305966 |
| 2020 | 05/18/20 | 21 | 0.212681 |
| 2020 | 05/25/20 | 22 | 0.16518 |
| 2020 | 06/01/20 | 23 | 0.339751 |
| 2020 | 06/08/20 | 24 | 0.279818 |
| 2020 | 06/15/20 | 25 | 0.38117 |
| 2020 | 06/22/20 | 26 | 0.282336 |
| 2020 | 06/29/20 | 27 | 0.210322 |
| 2020 | 07/06/20 | 28 | 0.176197 |
| 2020 | 07/13/20 | 29 | 0.37594 |
| 2020 | 07/20/20 | 30 | 0.150451 |
| 2020 | 07/27/20 | 31 | 0.132626 |
| 2020 | 08/03/20 | 32 | 0.176141 |
| 2020 | 08/10/20 | 33 | 0.132385 |
| 2020 | 08/17/20 | 34 | 0.226904 |
| 2020 | 08/24/20 | 35 | 0.314861 |
| 2020 | 08/31/20 | 36 | 0.201675 |
| 2020 | 09/07/20 | 37 | 0.186246 |
| 2020 | 09/14/20 | 38 | 0.39985 |
| 2020 | 09/21/20 | 39 | 0.224669 |
| 2020 | 09/28/20 | 40 | 0.330089 |
| 2020 | 10/05/20 | 41 | 0.400802 |
| 2020 | 10/12/20 | 42 | 0.350483 |
| 2020 | 10/19/20 | 43 | 0.25138 |
| 2020 | 10/26/20 | 44 | 0.201148 |
| 2020 | 11/02/20 | 45 | 0.176706 |
| 2020 | 11/09/20 | 46 | 0.221837 |
Fish data set in this page
Fish, Hawaii state DLNR, Pounds refers to total catch, Akule.Opelu refers to pounds for the two kinds of fish
| Year | Month | Pounds | Akule.Opelu |
| 1999 | Jan | 2064023 | 85331 |
| 1999 | Feb | 2286785 | 89537 |
| 1999 | Mar | 2083789 | 112897 |
| 1999 | Apr | 2446840 | 136301 |
| 1999 | May | 2300842 | 103692 |
| 1999 | Jun | 2340116 | 134432 |
| 1999 | Jul | 2646429 | 138814 |
| 1999 | Aug | 2254408 | 96569 |
| 1999 | Sep | 1926381 | 56598 |
| 1999 | Oct | 2233789 | 76834 |
| 1999 | Nov | 1730672 | 134706 |
| 1999 | Dec | 1762375 | 92255 |
| 2000 | Jan | 1501164 | 147104 |
| 2000 | Feb | 1993373 | 104165 |
| 2000 | Mar | 2220831 | 132028 |
| 2000 | Apr | 2398180 | 119224 |
| 2000 | May | 2557229 | 121268 |
| 2000 | Jun | 2510298 | 145200 |
| 2000 | Jul | 2270954 | 93883 |
| 2000 | Aug | 1912654 | 69107 |
| 2000 | Sep | 1365264 | 65007 |
| 2000 | Oct | 1615117 | 51208 |
| 2000 | Nov | 1388453 | 117493 |
| 2000 | Dec | 1802926 | 121486 |
| 2001 | Jan | 1481810 | 170702 |
| 2001 | Feb | 1496356 | 44575 |
| 2001 | Mar | 1579528 | 101764 |
| 2001 | Apr | 1184591 | 89388 |
| 2001 | May | 2091424 | 124193 |
| 2001 | Jun | 1966886 | 61122 |
| 2001 | Jul | 2113931 | 73266 |
| 2001 | Aug | 1926661 | 29386 |
| 2001 | Sep | 1353429 | 30268 |
| 2001 | Oct | 1338289 | 29577 |
| 2001 | Nov | 1747198 | 80350 |
| 2001 | Dec | 1458336 | 22817 |
| 2002 | Jan | 1517609 | 107406 |
| 2002 | Feb | 1729084 | 31030 |
| 2002 | Mar | 1747985 | 67691 |
| 2002 | Apr | 2109451 | 101043 |
| 2002 | May | 2069921 | 57251 |
| 2002 | Jun | 1640151 | 100501 |
| 2002 | Jul | 1979382 | 87584 |
| 2002 | Aug | 1831678 | 65566 |
| 2002 | Sep | 1734201 | 53162 |
| 2002 | Oct | 1779207 | 93867 |
| 2002 | Nov | 2191825 | 106167 |
| 2002 | Dec | 2576191 | 67881 |
| 2003 | Jan | 1910500 | 49420 |
| 2003 | Feb | 2075168 | 55006 |
| 2003 | Mar | 2245753 | 71616 |
| 2003 | Apr | 1562751 | 102993 |
| 2003 | May | 2440228 | 106600 |
| 2003 | Jun | 1842907 | 101715 |
| 2003 | Jul | 1957279 | 48453 |
| 2003 | Aug | 2143823 | 69130 |
| 2003 | Sep | 1503212 | 74525 |
| 2003 | Oct | 1611779 | 70949 |
| 2003 | Nov | 1668167 | 54004 |
| 2003 | Dec | 2312537 | 43054 |
| 2004 | Jan | 1605595 | 75751 |
| 2004 | Feb | 1705533 | 94864 |
| 2004 | Mar | 2079402 | 120305 |
| 2004 | Apr | 1883704 | 90950 |
| 2004 | May | 1830168 | 111599 |
| 2004 | Jun | 1918622 | 76392 |
| 2004 | Jul | 2029787 | 98937 |
| 2004 | Aug | 1928009 | 72577 |
| 2004 | Sep | 1620224 | 82650 |
| 2004 | Oct | 1854643 | 74587 |
| 2004 | Nov | 1981567 | 59753 |
| 2004 | Dec | 2022272 | 44353 |
| 2005 | Jan | 2088821 | 60972 |
| 2005 | Feb | 2106948 | 59469 |
| 2005 | Mar | 2386327 | 84551 |
| 2005 | Apr | 2122171 | 101099 |
| 2005 | May | 2369953 | 79042 |
| 2005 | Jun | 2342117 | 104814 |
| 2005 | Jul | 2281871 | 71065 |
| 2005 | Aug | 2124303 | 53383 |
| 2005 | Sep | 1734986 | 37195 |
| 2005 | Oct | 1920131 | 48632 |
| 2005 | Nov | 1969506 | 88235 |
| 2005 | Dec | 2323933 | 98768 |
| 2006 | Jan | 1702766 | 50553 |
| 2006 | Feb | 2060204 | 89037 |
| 2006 | Mar | 2244570 | 33916 |
| 2006 | Apr | 2068922 | 74430 |
| 2006 | May | 2164076 | 108689 |
| 2006 | Jun | 1935951 | 89503 |
| 2006 | Jul | 1968513 | 93758 |
| 2006 | Aug | 1741802 | 111080 |
| 2006 | Sep | 1508897 | 44537 |
| 2006 | Oct | 1892535 | 46747 |
| 2006 | Nov | 2208173 | 82938 |
| 2006 | Dec | 1381412 | 42260 |
| 2007 | Jan | 2211384 | 114496 |
| 2007 | Feb | 2391437 | 60618 |
| 2007 | Mar | 2724021 | 94251 |
| 2007 | Apr | 2639245 | 90078 |
| 2007 | May | 3168913 | 129258 |
| 2007 | Jun | 2706972 | 116628 |
| 2007 | Jul | 2523392 | 129345 |
| 2007 | Aug | 2272502 | 88997 |
| 2007 | Sep | 2121837 | 71560 |
| 2007 | Oct | 2472996 | 52915 |
| 2007 | Nov | 3040118 | 107555 |
| 2007 | Dec | 2934174 | 39239 |
| 2008 | Jan | 2656539 | 44672 |
| 2008 | Feb | 3101819 | 35213 |
| 2008 | Mar | 2816846 | 74421 |
| 2008 | Apr | 3064837 | 63355 |
| 2008 | May | 3560993 | 52287 |
| 2008 | Jun | 2920219 | 33685 |
| 2008 | Jul | 2516561 | 31288 |
| 2008 | Aug | 2338205 | 62171 |
| 2008 | Sep | 2314458 | 31311 |
| 2008 | Oct | 2407240 | 42766 |
| 2008 | Nov | 2060666 | 75102 |
| 2008 | Dec | 2329268 | 74508 |
| 2009 | Jan | 2198569 | 44459 |
| 2009 | Feb | 2314764 | 33206 |
| 2009 | Mar | 1846459 | 64879 |
| 2009 | Apr | 2659230 | 36638 |
| 2009 | May | 2692440 | 77011 |
| 2009 | Jun | 2387175 | 49217 |
| 2009 | Jul | 2672895 | 55033 |
| 2009 | Aug | 2174027 | 40398 |
| 2009 | Sep | 2259153 | 51386 |
| 2009 | Oct | 2386749 | 58095 |
| 2009 | Nov | 2081706 | 51798 |
| 2009 | Dec | 2702871 | 55148 |
| 2010 | Jan | 2059964 | 40855 |
| 2010 | Feb | 2632985 | 100598 |
| 2010 | Mar | 2430562 | 39887 |
| 2010 | Apr | 2652013 | 40528 |
| 2010 | May | 2460228 | 71483 |
| 2010 | Jun | 2743053 | 120553 |
| 2010 | Jul | 2278847 | 96315 |
| 2010 | Aug | 2618427 | 62854 |
| 2010 | Sep | 2483861 | 66613 |
| 2010 | Oct | 2503321 | 53353 |
| 2010 | Nov | 2370032 | 104360 |
| 2010 | Dec | 2431047 | 57919 |
| 2011 | Jan | 2527241 | 37755 |
| 2011 | Feb | 2786453 | 51863 |
| 2011 | Mar | 3789076 | 40188 |
| 2011 | Apr | 3148826 | 60494 |
| 2011 | May | 3015187 | 49037 |
| 2011 | Jun | 2718583 | 58380 |
| 2011 | Jul | 2284521 | 43096 |
| 2011 | Aug | 2475519 | 33612 |
| 2011 | Sep | 2461640 | 48697 |
| 2011 | Oct | 2420554 | 49929 |
| 2011 | Nov | 2059769 | 63045 |
| 2011 | Dec | 2882776 | 64430 |
| 2012 | Jan | 2825116 | 42894 |
| 2012 | Feb | 2653892 | 23528 |
| 2012 | Mar | 2544758 | 39839 |
| 2012 | Apr | 3050109 | 47250 |
| 2012 | May | 3264666 | 41357 |
| 2012 | Jun | 2798204 | 56808 |
| 2012 | Jul | 3331174 | 46853 |
| 2012 | Aug | 2864088 | 62682 |
| 2012 | Sep | 2219536 | 33641 |
| 2012 | Oct | 2482162 | 47478 |
| 2012 | Nov | 2545142 | 49232 |
| 2012 | Dec | 3129507 | 35924 |
| 2013 | Jan | 2902748 | 32373 |
| 2013 | Feb | 2388197 | 21922 |
| 2013 | Mar | 2831279 | 41718 |
| 2013 | Apr | 2467444 | 54619 |
| 2013 | May | 3131153 | 57183 |
| 2013 | Jun | 2819983 | 33484 |
| 2013 | Jul | 3473180 | 44240 |
| 2013 | Aug | 2586863 | 52288 |
| 2013 | Sep | 2459258 | 38145 |
| 2013 | Oct | 3228317 | 48533 |
| 2013 | Nov | 2998732 | 53187 |
| 2013 | Dec | 3023918 | 33381 |
| 2014 | Jan | 2503733 | 31233 |
| 2014 | Feb | 2615184 | 33134 |
| 2014 | Mar | 2808639 | 38876 |
| 2014 | Apr | 2857514 | 45819 |
| 2014 | May | 3363746 | 58283 |
| 2014 | Jun | 2778689 | 54266 |
| 2014 | Jul | 2828847 | 41221 |
| 2014 | Aug | 3074061 | 39744 |
| 2014 | Sep | 2703440 | 40668 |
| 2014 | Oct | 2744813 | 37263 |
| 2014 | Nov | 2541143 | 72020 |
| 2014 | Dec | 3325799 | 44128 |
| 2015 | Jan | 3130822 | 54942 |
| 2015 | Feb | 2806020 | 45098 |
| 2015 | Mar | 3560866 | 53378 |
| 2015 | Apr | 3341695 | 43642 |
| 2015 | May | 3717487 | 70583 |
| 2015 | Jun | 3678283 | 56578 |
| 2015 | Jul | 3954460 | 53615 |
| 2015 | Aug | 3016100 | 42015 |
| 2015 | Sep | 2209724 | 38904 |
| 2015 | Oct | 2795409 | 55583 |
| 2015 | Nov | 3426753 | 70399 |
| 2015 | Dec | 3357454 | 51095 |
| 2016 | Jan | 3087231 | 54089 |
| 2016 | Feb | 3374485 | 48683 |
| 2016 | Mar | 3260054 | 45472 |
| 2016 | Apr | 2930106 | 63926 |
| 2016 | May | 3383331 | 76757 |
| 2016 | Jun | 3209613 | 45557 |
| 2016 | Jul | 2765143 | 37198 |
| 2016 | Aug | 2732867 | 40213 |
| 2016 | Sep | 2180347 | 41660 |
| 2016 | Oct | 2298348 | 34699 |
| 2016 | Nov | 2545574 | 71924 |
| 2016 | Dec | 3691485 | 37448 |
| 2017 | Jan | 3383297 | 48974 |
| 2017 | Feb | 2856584 | 35716 |
| 2017 | Mar | 3413039 | 39789 |
| 2017 | Apr | 3361156 | 30625 |
| 2017 | May | 3576410 | 31092 |
| 2017 | Jun | 3348469 | 27734 |
| 2017 | Jul | 2741187 | 27041 |
| 2017 | Aug | 2675625 | 32476 |
| 2017 | Sep | 2700675 | 33394 |
| 2017 | Oct | 2779159 | 31373 |
| 2017 | Nov | 2817012 | 40681 |
| 2017 | Dec | 3726216 | 33955 |
| 2018 | Jan | 3361591 | 46166 |
| 2018 | Feb | 2625263 | 29890 |
| 2018 | Mar | 3219102 | 31454 |
| 2018 | Apr | 3593287 | 25954 |
| 2018 | May | 3798285 | 35908 |
| 2018 | Jun | 3362829 | 31899 |
| 2018 | Jul | 2735326 | 30968 |
| 2018 | Aug | 2397549 | 19849 |
| 2018 | Sep | 2323735 | 29324 |
| 2018 | Oct | 2472451 | 28927 |
| 2018 | Nov | 2687466 | 40497 |
| 2018 | Dec | 3236293 | 36603 |