
12.2: Coding for Carry-Over Covariates
- Page ID
- 33196

The late Dr. Steve Arnold (Penn State), came up with a satisfactory solution to account for carry-over effects in the data analysis. The following example will illustrate how the procedure works. The data can be found in the textbook Design of Experiments, by Kuehl, as Example 16.1. Investigators want to evaluate the effect of 3 diets on Neutral Detergent Fiber (NDF) levels in steer. The three diets are administered to each steer in a sequence over 3 periods. A total of 6 sequences were used and two steers were assigned to each sequence of treatments.
The cross-over design can be summarized as:
| Period | |||
|---|---|---|---|
| Sequence | 1 | 2 | 3 |
| 1 | A | B | C |
| 2 | B | C | A |
| 3 | C | A | B |
| 4 | A | C | B |
| 5 | B | A | C |
| 6 | C | B | A |
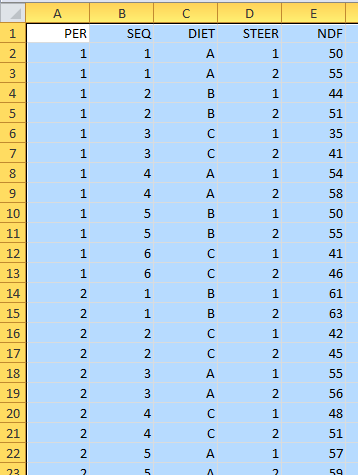
If we look at the first part of the dataset (Steer Data) for this example in Excel, we can see the following:
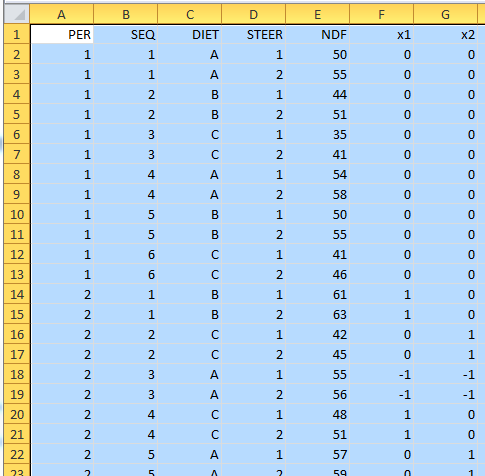
We need now to add two columns to use an effect-type coding for the 3 treatment levels. We can use:
| \(x_1\) | \(x_2\) | |
|---|---|---|
| A | 1 | 0 |
| B | 0 | 1 |
| C | -1 | -1 |
Where \(x_{1}\) and \(x_{2}\) will be columns we create in the data to input for all of the rows of data. The coding values depend on which treatment level is administered during the previous period. For example, if treatment A was administered in the previous period, then coding values would be \(x_{1}=1, x_{2}=0\).
There will be no entries for the first period because on the first application of each treatment there are no treatments that have preceded it. Therefore a 0 is used as the coding value for both \(x_{1}\) and \(x_{2}\).
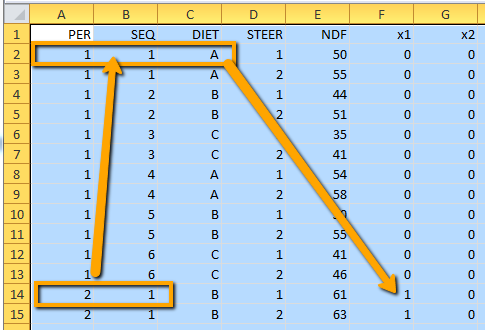
Looking at Period 2, sequence 1, treatment B we can refer back to the Sequence chart and see that it was preceded by treatment level A, so we assign \(x_{1}=1\), and \(x_{2}=0\), indicating that it was treatment A that could produce a carry-over effect here.
The process can be repeated to define the coding variables to each entry in the dataset. The coded variables \(x_{1}\) and \(x_{2}\) are then entered into the general linear model as continuous covariates and LSmeans for treatments are adjusted for carry-over effects.