Statistics LibreTexts

3.1: Introduction to Probability

  • Page ID
    51639
  • \( \newcommand{\vecs}[1]{\overset { \scriptstyle \rightharpoonup} {\mathbf{#1}} } \)

    \( \newcommand{\vecd}[1]{\overset{-\!-\!\rightharpoonup}{\vphantom{a}\smash {#1}}} \)

    \( \newcommand{\id}{\mathrm{id}}\) \( \newcommand{\Span}{\mathrm{span}}\)

    ( \newcommand{\kernel}{\mathrm{null}\,}\) \( \newcommand{\range}{\mathrm{range}\,}\)

    \( \newcommand{\RealPart}{\mathrm{Re}}\) \( \newcommand{\ImaginaryPart}{\mathrm{Im}}\)

    \( \newcommand{\Argument}{\mathrm{Arg}}\) \( \newcommand{\norm}[1]{\| #1 \|}\)

    \( \newcommand{\inner}[2]{\langle #1, #2 \rangle}\)

    \( \newcommand{\Span}{\mathrm{span}}\)

    \( \newcommand{\id}{\mathrm{id}}\)

    \( \newcommand{\Span}{\mathrm{span}}\)

    \( \newcommand{\kernel}{\mathrm{null}\,}\)

    \( \newcommand{\range}{\mathrm{range}\,}\)

    \( \newcommand{\RealPart}{\mathrm{Re}}\)

    \( \newcommand{\ImaginaryPart}{\mathrm{Im}}\)

    \( \newcommand{\Argument}{\mathrm{Arg}}\)

    \( \newcommand{\norm}[1]{\| #1 \|}\)

    \( \newcommand{\inner}[2]{\langle #1, #2 \rangle}\)

    \( \newcommand{\Span}{\mathrm{span}}\) \( \newcommand{\AA}{\unicode[.8,0]{x212B}}\)

    \( \newcommand{\vectorA}[1]{\vec{#1}}      % arrow\)

    \( \newcommand{\vectorAt}[1]{\vec{\text{#1}}}      % arrow\)

    \( \newcommand{\vectorB}[1]{\overset { \scriptstyle \rightharpoonup} {\mathbf{#1}} } \)

    \( \newcommand{\vectorC}[1]{\textbf{#1}} \)

    \( \newcommand{\vectorD}[1]{\overrightarrow{#1}} \)

    \( \newcommand{\vectorDt}[1]{\overrightarrow{\text{#1}}} \)

    \( \newcommand{\vectE}[1]{\overset{-\!-\!\rightharpoonup}{\vphantom{a}\smash{\mathbf {#1}}}} \)

    \( \newcommand{\vecs}[1]{\overset { \scriptstyle \rightharpoonup} {\mathbf{#1}} } \)

    \( \newcommand{\vecd}[1]{\overset{-\!-\!\rightharpoonup}{\vphantom{a}\smash {#1}}} \)

    \(\newcommand{\avec}{\mathbf a}\) \(\newcommand{\bvec}{\mathbf b}\) \(\newcommand{\cvec}{\mathbf c}\) \(\newcommand{\dvec}{\mathbf d}\) \(\newcommand{\dtil}{\widetilde{\mathbf d}}\) \(\newcommand{\evec}{\mathbf e}\) \(\newcommand{\fvec}{\mathbf f}\) \(\newcommand{\nvec}{\mathbf n}\) \(\newcommand{\pvec}{\mathbf p}\) \(\newcommand{\qvec}{\mathbf q}\) \(\newcommand{\svec}{\mathbf s}\) \(\newcommand{\tvec}{\mathbf t}\) \(\newcommand{\uvec}{\mathbf u}\) \(\newcommand{\vvec}{\mathbf v}\) \(\newcommand{\wvec}{\mathbf w}\) \(\newcommand{\xvec}{\mathbf x}\) \(\newcommand{\yvec}{\mathbf y}\) \(\newcommand{\zvec}{\mathbf z}\) \(\newcommand{\rvec}{\mathbf r}\) \(\newcommand{\mvec}{\mathbf m}\) \(\newcommand{\zerovec}{\mathbf 0}\) \(\newcommand{\onevec}{\mathbf 1}\) \(\newcommand{\real}{\mathbb R}\) \(\newcommand{\twovec}[2]{\left[\begin{array}{r}#1 \\ #2 \end{array}\right]}\) \(\newcommand{\ctwovec}[2]{\left[\begin{array}{c}#1 \\ #2 \end{array}\right]}\) \(\newcommand{\threevec}[3]{\left[\begin{array}{r}#1 \\ #2 \\ #3 \end{array}\right]}\) \(\newcommand{\cthreevec}[3]{\left[\begin{array}{c}#1 \\ #2 \\ #3 \end{array}\right]}\) \(\newcommand{\fourvec}[4]{\left[\begin{array}{r}#1 \\ #2 \\ #3 \\ #4 \end{array}\right]}\) \(\newcommand{\cfourvec}[4]{\left[\begin{array}{c}#1 \\ #2 \\ #3 \\ #4 \end{array}\right]}\) \(\newcommand{\fivevec}[5]{\left[\begin{array}{r}#1 \\ #2 \\ #3 \\ #4 \\ #5 \\ \end{array}\right]}\) \(\newcommand{\cfivevec}[5]{\left[\begin{array}{c}#1 \\ #2 \\ #3 \\ #4 \\ #5 \\ \end{array}\right]}\) \(\newcommand{\mattwo}[4]{\left[\begin{array}{rr}#1 \amp #2 \\ #3 \amp #4 \\ \end{array}\right]}\) \(\newcommand{\laspan}[1]{\text{Span}\{#1\}}\) \(\newcommand{\bcal}{\cal B}\) \(\newcommand{\ccal}{\cal C}\) \(\newcommand{\scal}{\cal S}\) \(\newcommand{\wcal}{\cal W}\) \(\newcommand{\ecal}{\cal E}\) \(\newcommand{\coords}[2]{\left\{#1\right\}_{#2}}\) \(\newcommand{\gray}[1]{\color{gray}{#1}}\) \(\newcommand{\lgray}[1]{\color{lightgray}{#1}}\) \(\newcommand{\rank}{\operatorname{rank}}\) \(\newcommand{\row}{\text{Row}}\) \(\newcommand{\col}{\text{Col}}\) \(\renewcommand{\row}{\text{Row}}\) \(\newcommand{\nul}{\text{Nul}}\) \(\newcommand{\var}{\text{Var}}\) \(\newcommand{\corr}{\text{corr}}\) \(\newcommand{\len}[1]{\left|#1\right|}\) \(\newcommand{\bbar}{\overline{\bvec}}\) \(\newcommand{\bhat}{\widehat{\bvec}}\) \(\newcommand{\bperp}{\bvec^\perp}\) \(\newcommand{\xhat}{\widehat{\xvec}}\) \(\newcommand{\vhat}{\widehat{\vvec}}\) \(\newcommand{\uhat}{\widehat{\uvec}}\) \(\newcommand{\what}{\widehat{\wvec}}\) \(\newcommand{\Sighat}{\widehat{\Sigma}}\) \(\newcommand{\lt}{<}\) \(\newcommand{\gt}{>}\) \(\newcommand{\amp}{&}\) \(\definecolor{fillinmathshade}{gray}{0.9}\)

    In this section, we will explore probability through the context of experiments. An experiment is a process whose outcomes are unknown. Imagine we are playing a game with a spinner.

    Probability from a Spinner

    Here's how it works. You'll spin the spinner. How do you win? That's up to you. Two options:

    • Spinner lands on RED, you win.
    • Spinner lands on BLUE, you win.

    Which option do you want? Explain why.

    a simple spinner with a circular shape divided into two portions—one colored red makes up three-quarters and the other blue makes up one-quarter.

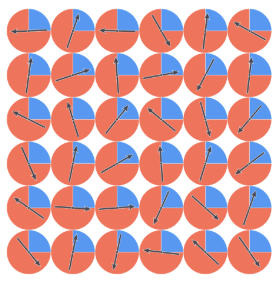
    If you were to play the game many times (say, 36 times in a row), which option would you choose? Explain why.

    36 simple spinners with each being a circular shape divided into two portions—one colored red makes up three-quarters and the other blue makes up one-quarter.

    Damian plays the game 36 times. The number of times the spinner landed on red and on blue are given in the table below. Complete the third column in the table with the relative frequencies written as fractions and decimals rounded to three decimal places.

    Number of Spins

    Relative Frequency

    Landed on Red

    26

    Landed on Blue

    10

    Total

    36

    The table shows the results for an entire class. Write the relative frequencies (the empirical probability) as fractions and decimals rounded to three decimal places into the table. Which event appears more likely? Explain.

    Number of Spins

    Relative Frequency

    Landed on Red

    935

    Landed on Blue

    325

    Total

    1260

    Probability is the measure of the likelihood of a random event or chance behavior occurring. When we use outcomes from previous repetitions or trials of an experiment to calculate the probability of the next trial, we are calculating Empirical Probability. Theoretical Probability is calculated by dividing the number of outcomes in an event by the total number of all possible outcomes.

    • What is the (theoretical) probability that the spinner lands on red?
    • What is the (theoretical) probability that the spinner lands on blue?

    In this class, the experiment has been repeated _________ times (the spinner was spun _________ times). The empirical probability (or proportion, or relative frequency) for the event "Landed on Red" is trending toward the theoretical probability, \(\frac{3}{4}=0.75=75 \%\). Similarly, the empirical probability (or proportion or relative frequency) for the event "Landed on Blue" is trending toward the theoretical probability, \(\frac{1}{4}=0.25=25 \%\). This phenomenon is referred to as the law of large numbers. As the number of repetitions of a probability experiment increases, the proportion with which a certain outcome is observed gets closer to the probability of the outcome. For this spinner, it is more likely to land on red, and less likely to land on blue.

    Can probability be more than 1? Explain your reasoning.

    Can probability be negative? Explain your reasoning.

    Malik and Mia played 36 rounds with a different spinner. Their results are shown in the table. Select the spinner(s) that they most likely used. Explain your reasoning.

    Number of Spins

    Landed on Red

    17

    Landed on Blue

    19

    Total

    36

    a simple spinner with a circular shape divided into two portions—one colored blue makes up three-quarters and the other red makes up one-quarter.A simple spinner with equal blue and red areas.A simple spinner with equal blue and red areas.A simple spinner with equal blue, red, and black areas.

    Here's a spinner Calon created where landing on red is almost impossible, and landing on blue is almost certain.

    A simple spinner with most its area colored blue, and a small sliver colored red.

    Enter the relative frequencies into the table. Write the number of spins you might expect to see that landed on red and on blue in the table. Then calculate the relative frequencies as decimals rounded to three decimal places.

    Number of Spins

    Relative Frequency

    Landed on Red

    Landed on Blue

    Total

    36

    \(\frac{36}{36}=1=100 \%\)

    • What number should probabilities always add to?

    Malik claims he can create a spinner where red and blue are both unlikely. Mia says that's not possible. Who do you think is correct? Justify your answer.

    Summary

    The Law of Large Numbers states that empirical probability approaches theoretical probability as the number of trials of a probability experiment are repeated.

    The sample space, S, of a probability experiment is the collection of all possible outcomes. For example, the sample space for our spinner experiment is S={lands on blue, lands on red}. An event, sometimes denoted E, is any collection of one or more outcomes from a probability experiment. For example, one event from our spinner experiment could be E={lands on blue}.

    Basic Rules of Probability:

    • The probability of any event E, is between 0 and 1 (inclusive). If the probability of an event is 0, then the event is impossible. If the probability of an event is 1, then the event is certain. Probability is never negative (less than 0) and is never more than 1.
    • The sum of the probabilities of all outcomes must equal 1.

    Probability from a Pair of Dice

    Now, consider a pair of fair dice (a fair die is a die in which every outcome is equally likely to be rolled). Write all possible outcomes from rolling one die.

    There are 6 possible outcomes from the first die, and 6 possible outcomes from the second die. Therefore, the sample space is composed of all combinations of these outcomes. There are 36 elements in the sample space. Fill in the table with the remaining outcomes.

    Roll a…

    1 on the 2nd Die

    2 on the 2nd Die

    3 on the 2nd Die

    4 on the 2nd Die

    5 on the 2nd Die

    6 on the 2nd Die

    1 on the 1st Die

    1, 1

    1, 2

    1, 3

    1, 4

    1, 5

    1, 6

    2 on the 1st Die

    2, 1

    2, 2

    2, 3

    2, 4

    2, 5


    3 on the 1st Die

    3, 1

    3, 2

    3, 3

    3, 4


    4 on the 1st Die

    4, 1

    4, 2

    4, 3


    5 on the 1st Die

    5, 1

    5, 2


    6 on the 1st Die

    6, 1


    There are 36 elements in the sample space. We will consider the total number of dots on the dice as an outcome in the sample space. Fill in the table with the remaining sums.

    Roll a…

    1 on the 2nd Die

    2 on the 2nd Die

    3 on the 2nd Die

    4 on the 2nd Die

    5 on the 2nd Die

    6 on the 2nd Die

    1 on the 1st Die

    2

    3

    4

    5

    6

    7

    2 on the 1st Die

    3

    4

    5

    6


    3 on the 1st Die

    4

    5

    6


    4 on the 1st Die

    5

    6


    5 on the 1st Die

    6


    6 on the 1st Die

    7


    The sample space that contains all possible outcomes from rolling two fair dice is [2,3,4,5,6,7,3,4,5,6,7,8,4,5,6,7,8,9,5,6,7,8,9,10,6,7,8,9,10,11,7,8,9,10,11,12]. The probability of rolling a 1, (which can be written as P(1), read “P of one”) is \(\frac{0}{36}=0\). It is impossible to roll a 1. The probability of rolling a 2, \(P(2)=\frac{1}{36}\) which is about 0.028. It is very unlikely to roll a 2. The probability of rolling a 3 is \(P(3)=\frac{2}{36}\) which is about 0.056. Notice that there are two ways to roll a 3:

    • We roll 1 on the first die and 2 on the second die
    • We roll 2 on the first die and 1 on the second die

    P(7)= _______≈_______

    P(8)= _______≈_______

    P(9)= _______≈_______

    P(10)= _______≈_______

    P(11)= _______≈_______

    P(12)= _______≈_______

    Pick a number. If it is rolled from two dice, you win!

    • Which number should you pick? (Think about probabilities). Explain how you made your choice.
    • Try it! Go to https://www.random.org/dice/ and click roll dice. Did you win?

    This page titled 3.1: Introduction to Probability is shared under a CC BY-NC-SA 4.0 license and was authored, remixed, and/or curated by Hannah Seidler-Wright.

    • Was this article helpful?