Statistics LibreTexts

1.1: Data analysis steps

  • Page ID
    6393
  • \( \newcommand{\vecs}[1]{\overset { \scriptstyle \rightharpoonup} {\mathbf{#1}} } \)

    \( \newcommand{\vecd}[1]{\overset{-\!-\!\rightharpoonup}{\vphantom{a}\smash {#1}}} \)

    \( \newcommand{\id}{\mathrm{id}}\) \( \newcommand{\Span}{\mathrm{span}}\)

    ( \newcommand{\kernel}{\mathrm{null}\,}\) \( \newcommand{\range}{\mathrm{range}\,}\)

    \( \newcommand{\RealPart}{\mathrm{Re}}\) \( \newcommand{\ImaginaryPart}{\mathrm{Im}}\)

    \( \newcommand{\Argument}{\mathrm{Arg}}\) \( \newcommand{\norm}[1]{\| #1 \|}\)

    \( \newcommand{\inner}[2]{\langle #1, #2 \rangle}\)

    \( \newcommand{\Span}{\mathrm{span}}\)

    \( \newcommand{\id}{\mathrm{id}}\)

    \( \newcommand{\Span}{\mathrm{span}}\)

    \( \newcommand{\kernel}{\mathrm{null}\,}\)

    \( \newcommand{\range}{\mathrm{range}\,}\)

    \( \newcommand{\RealPart}{\mathrm{Re}}\)

    \( \newcommand{\ImaginaryPart}{\mathrm{Im}}\)

    \( \newcommand{\Argument}{\mathrm{Arg}}\)

    \( \newcommand{\norm}[1]{\| #1 \|}\)

    \( \newcommand{\inner}[2]{\langle #1, #2 \rangle}\)

    \( \newcommand{\Span}{\mathrm{span}}\) \( \newcommand{\AA}{\unicode[.8,0]{x212B}}\)

    \( \newcommand{\vectorA}[1]{\vec{#1}}      % arrow\)

    \( \newcommand{\vectorAt}[1]{\vec{\text{#1}}}      % arrow\)

    \( \newcommand{\vectorB}[1]{\overset { \scriptstyle \rightharpoonup} {\mathbf{#1}} } \)

    \( \newcommand{\vectorC}[1]{\textbf{#1}} \)

    \( \newcommand{\vectorD}[1]{\overrightarrow{#1}} \)

    \( \newcommand{\vectorDt}[1]{\overrightarrow{\text{#1}}} \)

    \( \newcommand{\vectE}[1]{\overset{-\!-\!\rightharpoonup}{\vphantom{a}\smash{\mathbf {#1}}}} \)

    \( \newcommand{\vecs}[1]{\overset { \scriptstyle \rightharpoonup} {\mathbf{#1}} } \)

    \( \newcommand{\vecd}[1]{\overset{-\!-\!\rightharpoonup}{\vphantom{a}\smash {#1}}} \)

    \(\newcommand{\avec}{\mathbf a}\) \(\newcommand{\bvec}{\mathbf b}\) \(\newcommand{\cvec}{\mathbf c}\) \(\newcommand{\dvec}{\mathbf d}\) \(\newcommand{\dtil}{\widetilde{\mathbf d}}\) \(\newcommand{\evec}{\mathbf e}\) \(\newcommand{\fvec}{\mathbf f}\) \(\newcommand{\nvec}{\mathbf n}\) \(\newcommand{\pvec}{\mathbf p}\) \(\newcommand{\qvec}{\mathbf q}\) \(\newcommand{\svec}{\mathbf s}\) \(\newcommand{\tvec}{\mathbf t}\) \(\newcommand{\uvec}{\mathbf u}\) \(\newcommand{\vvec}{\mathbf v}\) \(\newcommand{\wvec}{\mathbf w}\) \(\newcommand{\xvec}{\mathbf x}\) \(\newcommand{\yvec}{\mathbf y}\) \(\newcommand{\zvec}{\mathbf z}\) \(\newcommand{\rvec}{\mathbf r}\) \(\newcommand{\mvec}{\mathbf m}\) \(\newcommand{\zerovec}{\mathbf 0}\) \(\newcommand{\onevec}{\mathbf 1}\) \(\newcommand{\real}{\mathbb R}\) \(\newcommand{\twovec}[2]{\left[\begin{array}{r}#1 \\ #2 \end{array}\right]}\) \(\newcommand{\ctwovec}[2]{\left[\begin{array}{c}#1 \\ #2 \end{array}\right]}\) \(\newcommand{\threevec}[3]{\left[\begin{array}{r}#1 \\ #2 \\ #3 \end{array}\right]}\) \(\newcommand{\cthreevec}[3]{\left[\begin{array}{c}#1 \\ #2 \\ #3 \end{array}\right]}\) \(\newcommand{\fourvec}[4]{\left[\begin{array}{r}#1 \\ #2 \\ #3 \\ #4 \end{array}\right]}\) \(\newcommand{\cfourvec}[4]{\left[\begin{array}{c}#1 \\ #2 \\ #3 \\ #4 \end{array}\right]}\) \(\newcommand{\fivevec}[5]{\left[\begin{array}{r}#1 \\ #2 \\ #3 \\ #4 \\ #5 \\ \end{array}\right]}\) \(\newcommand{\cfivevec}[5]{\left[\begin{array}{c}#1 \\ #2 \\ #3 \\ #4 \\ #5 \\ \end{array}\right]}\) \(\newcommand{\mattwo}[4]{\left[\begin{array}{rr}#1 \amp #2 \\ #3 \amp #4 \\ \end{array}\right]}\) \(\newcommand{\laspan}[1]{\text{Span}\{#1\}}\) \(\newcommand{\bcal}{\cal B}\) \(\newcommand{\ccal}{\cal C}\) \(\newcommand{\scal}{\cal S}\) \(\newcommand{\wcal}{\cal W}\) \(\newcommand{\ecal}{\cal E}\) \(\newcommand{\coords}[2]{\left\{#1\right\}_{#2}}\) \(\newcommand{\gray}[1]{\color{gray}{#1}}\) \(\newcommand{\lgray}[1]{\color{lightgray}{#1}}\) \(\newcommand{\rank}{\operatorname{rank}}\) \(\newcommand{\row}{\text{Row}}\) \(\newcommand{\col}{\text{Col}}\) \(\renewcommand{\row}{\text{Row}}\) \(\newcommand{\nul}{\text{Nul}}\) \(\newcommand{\var}{\text{Var}}\) \(\newcommand{\corr}{\text{corr}}\) \(\newcommand{\len}[1]{\left|#1\right|}\) \(\newcommand{\bbar}{\overline{\bvec}}\) \(\newcommand{\bhat}{\widehat{\bvec}}\) \(\newcommand{\bperp}{\bvec^\perp}\) \(\newcommand{\xhat}{\widehat{\xvec}}\) \(\newcommand{\vhat}{\widehat{\vvec}}\) \(\newcommand{\uhat}{\widehat{\uvec}}\) \(\newcommand{\what}{\widehat{\wvec}}\) \(\newcommand{\Sighat}{\widehat{\Sigma}}\) \(\newcommand{\lt}{<}\) \(\newcommand{\gt}{>}\) \(\newcommand{\amp}{&}\) \(\definecolor{fillinmathshade}{gray}{0.9}\)
    Learning Objectives
    • How to determine the best way to analyze a biological experiment

    How to determine the appropriate statistical test

    A systematic, step-by-step approach is the best way to decide how to analyze biological data. It is recommended that you follow these steps:

    1. Specify the biological question you are asking.
    2. Put the question in the form of a biological null hypothesis and alternate hypothesis.
    3. Put the question in the form of a statistical null hypothesis and alternate hypothesis.
    4. Determine which variables are relevant to the question.
    5. Determine what kind of variable each one is.
    6. Design an experiment that controls or randomizes the confounding variables.
    7. Based on the number of variables, the kinds of variables, the expected fit to the parametric assumptions, and the hypothesis to be tested, choose the best statistical test to use.
    8. If possible, do a power analysis to determine a good sample size for the experiment.
    9. Do the experiment.
    10. Examine the data to see if it meets the assumptions of the statistical test you chose (primarily normality and homoscedasticity for tests of measurement variables). If it doesn't, choose a more appropriate test.
    11. Apply the statistical test you chose, and interpret the results.
    12. Communicate your results effectively, usually with a graph or table.

    As you work your way through this textbook, you'll learn about the different parts of this process. One important point for you to remember: "do the experiment" is step 9, not step 1. You should do a lot of thinking, planning, and decision-making before you do an experiment. If you do this, you'll have an experiment that is easy to understand, easy to analyze and interpret, answers the questions you're trying to answer, and is neither too big nor too small. If you just slap together an experiment without thinking about how you're going to do the statistics, you may end up needing more complicated and obscure statistical tests, getting results that are difficult to interpret and explain to others, and maybe using too many subjects (thus wasting your resources) or too few subjects (thus wasting the whole experiment).

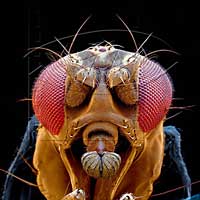
    Here's an example of how the procedure works. Verrelli and Eanes (2001) measured glycogen content in Drosophila melanogaster individuals. The flies were polymorphic at the genetic locus that codes for the enzyme phosphoglucomutase (PGM). At site \(52\) in the PGM protein sequence, flies had either a valine or an alanine. At site \(484\), they had either a valine or a leucine. All four combinations of amino acids (V-V, V-L, A-V, A-L) were present.

    drosophila-head.jpg
    Fig. 1.1.1 Drosophila melanogaster
    1. One biological question is "Do the amino acid polymorphisms at the Pgm locus have an effect on glycogen content?" The biological question is usually something about biological processes, often in the form "Does changing \(X\) cause a change in \(Y\)?" You might want to know whether a drug changes blood pressure; whether soil pH affects the growth of blueberry bushes; or whether protein Rab10 mediates membrane transport to cilia.
    2. The biological null hypothesis is "Different amino acid sequences do not affect the biochemical properties of PGM, so glycogen content is not affected by PGM sequence." The biological alternative hypothesis is "Different amino acid sequences do affect the biochemical properties of PGM, so glycogen content is affected by PGM sequence." By thinking about the biological null and alternative hypotheses, you are making sure that your experiment will give different results for different answers to your biological question.
    3. The statistical null hypothesis is "Flies with different sequences of the PGM enzyme have the same average glycogen content." The alternate hypothesis is "Flies with different sequences of PGM have different average glycogen contents." While the biological null and alternative hypotheses are about biological processes, the statistical null and alternative hypotheses are all about the numbers; in this case, the glycogen contents are either the same or different. Testing your statistical null hypothesis is the main subject of this handbook, and it should give you a clear answer; you will either reject or accept that statistical null. Whether rejecting a statistical null hypothesis is enough evidence to answer your biological question can be a more difficult, more subjective decision; there may be other possible explanations for your results, and you as an expert in your specialized area of biology will have to consider how plausible they are.
    4. The two relevant variables in the Verrelli and Eanes experiment are glycogen content and PGM sequence.
    5. Glycogen content is a measurement variable, something that you record as a number that could have many possible values. The sequence of PGM that a fly has (V-V, V-L, A-V or A-L) is a nominal variable, something with a small number of possible values (four, in this case) that you usually record as a word.
    6. Other variables that might be important, such as age and where in a vial the fly pupated, were either controlled (flies of all the same age were used) or randomized (flies were taken randomly from the vials without regard to where they pupated). It also would have been possible to observe the confounding variables; for example, Verrelli and Eanes could have used flies of different ages, and then used a statistical technique that adjusted for the age. This would have made the analysis more complicated to perform and more difficult to explain, and while it might have turned up something interesting about age and glycogen content, it would not have helped address the main biological question about PGM genotype and glycogen content.
    7. Because the goal is to compare the means of one measurement variable among groups classified by one nominal variable, and there are more than two categories, the appropriate statistical test is a one-way anova. Once you know what variables you're analyzing and what type they are, the number of possible statistical tests is usually limited to one or two (at least for tests I present in this handbook).
    8. A power analysis would have required an estimate of the standard deviation of glycogen content, which probably could have been found in the published literature, and a number for the effect size (the variation in glycogen content among genotypes that the experimenters wanted to detect). In this experiment, any difference in glycogen content among genotypes would be interesting, so the experimenters just used as many flies as was practical in the time available.
    9. The experiment was done: glycogen content was measured in flies with different PGM sequences.
    10. The anova assumes that the measurement variable, glycogen content, is normal (the distribution fits the bell-shaped normal curve) and homoscedastic (the variances in glycogen content of the different PGM sequences are equal), and inspecting histograms of the data shows that the data fit these assumptions. If the data hadn't met the assumptions of anova, the Kruskal–Wallis test or Welch's test might have been better.
    11. The one-way anova was done, using a spreadsheet, web page, or computer program, and the result of the anova is a \(P\) value less than \(0.05\). The interpretation is that flies with some PGM sequences have different average glycogen content than flies with other sequences of PGM.
    12. The results could be summarized in a table, but a more effective way to communicate them is with a graph:
    pgmgraph.gif
    Fig. 1.1.2 Glycogen content in Drosophila melanogaster. Each bar represents the mean glycogen content (in micrograms per fly) of 12 flies with the indicated PGM haplotype. Narrow bars represent 95% confidence intervals.

    References

    1. Picture of Drosophila melanogaster from Farkleberries.
    2. Verrelli, B.C., and W.F. Eanes. 2001. The functional impact of PGM amino acid polymorphism on glycogen content in Drosophila melanogaster. Genetics 159: 201-210. (Note that for the purposes of this web page, I've used a different statistical test than Verrelli and Eanes did. They were interested in interactions among the individual amino acid polymorphisms, so they used a two-way anova.)

    This page titled 1.1: Data analysis steps is shared under a not declared license and was authored, remixed, and/or curated by John H. McDonald via source content that was edited to the style and standards of the LibreTexts platform.

    • Was this article helpful?