
1.4: Using Fractions - Decimals and Percents to Describe Charts
- Page ID
- 7022

\( \newcommand{\vecs}[1]{\overset { \scriptstyle \rightharpoonup} {\mathbf{#1}} } \)
\( \newcommand{\vecd}[1]{\overset{-\!-\!\rightharpoonup}{\vphantom{a}\smash {#1}}} \)
\( \newcommand{\id}{\mathrm{id}}\) \( \newcommand{\Span}{\mathrm{span}}\)
( \newcommand{\kernel}{\mathrm{null}\,}\) \( \newcommand{\range}{\mathrm{range}\,}\)
\( \newcommand{\RealPart}{\mathrm{Re}}\) \( \newcommand{\ImaginaryPart}{\mathrm{Im}}\)
\( \newcommand{\Argument}{\mathrm{Arg}}\) \( \newcommand{\norm}[1]{\| #1 \|}\)
\( \newcommand{\inner}[2]{\langle #1, #2 \rangle}\)
\( \newcommand{\Span}{\mathrm{span}}\)
\( \newcommand{\id}{\mathrm{id}}\)
\( \newcommand{\Span}{\mathrm{span}}\)
\( \newcommand{\kernel}{\mathrm{null}\,}\)
\( \newcommand{\range}{\mathrm{range}\,}\)
\( \newcommand{\RealPart}{\mathrm{Re}}\)
\( \newcommand{\ImaginaryPart}{\mathrm{Im}}\)
\( \newcommand{\Argument}{\mathrm{Arg}}\)
\( \newcommand{\norm}[1]{\| #1 \|}\)
\( \newcommand{\inner}[2]{\langle #1, #2 \rangle}\)
\( \newcommand{\Span}{\mathrm{span}}\) \( \newcommand{\AA}{\unicode[.8,0]{x212B}}\)
\( \newcommand{\vectorA}[1]{\vec{#1}} % arrow\)
\( \newcommand{\vectorAt}[1]{\vec{\text{#1}}} % arrow\)
\( \newcommand{\vectorB}[1]{\overset { \scriptstyle \rightharpoonup} {\mathbf{#1}} } \)
\( \newcommand{\vectorC}[1]{\textbf{#1}} \)
\( \newcommand{\vectorD}[1]{\overrightarrow{#1}} \)
\( \newcommand{\vectorDt}[1]{\overrightarrow{\text{#1}}} \)
\( \newcommand{\vectE}[1]{\overset{-\!-\!\rightharpoonup}{\vphantom{a}\smash{\mathbf {#1}}}} \)
\( \newcommand{\vecs}[1]{\overset { \scriptstyle \rightharpoonup} {\mathbf{#1}} } \)
\( \newcommand{\vecd}[1]{\overset{-\!-\!\rightharpoonup}{\vphantom{a}\smash {#1}}} \)
\(\newcommand{\avec}{\mathbf a}\) \(\newcommand{\bvec}{\mathbf b}\) \(\newcommand{\cvec}{\mathbf c}\) \(\newcommand{\dvec}{\mathbf d}\) \(\newcommand{\dtil}{\widetilde{\mathbf d}}\) \(\newcommand{\evec}{\mathbf e}\) \(\newcommand{\fvec}{\mathbf f}\) \(\newcommand{\nvec}{\mathbf n}\) \(\newcommand{\pvec}{\mathbf p}\) \(\newcommand{\qvec}{\mathbf q}\) \(\newcommand{\svec}{\mathbf s}\) \(\newcommand{\tvec}{\mathbf t}\) \(\newcommand{\uvec}{\mathbf u}\) \(\newcommand{\vvec}{\mathbf v}\) \(\newcommand{\wvec}{\mathbf w}\) \(\newcommand{\xvec}{\mathbf x}\) \(\newcommand{\yvec}{\mathbf y}\) \(\newcommand{\zvec}{\mathbf z}\) \(\newcommand{\rvec}{\mathbf r}\) \(\newcommand{\mvec}{\mathbf m}\) \(\newcommand{\zerovec}{\mathbf 0}\) \(\newcommand{\onevec}{\mathbf 1}\) \(\newcommand{\real}{\mathbb R}\) \(\newcommand{\twovec}[2]{\left[\begin{array}{r}#1 \\ #2 \end{array}\right]}\) \(\newcommand{\ctwovec}[2]{\left[\begin{array}{c}#1 \\ #2 \end{array}\right]}\) \(\newcommand{\threevec}[3]{\left[\begin{array}{r}#1 \\ #2 \\ #3 \end{array}\right]}\) \(\newcommand{\cthreevec}[3]{\left[\begin{array}{c}#1 \\ #2 \\ #3 \end{array}\right]}\) \(\newcommand{\fourvec}[4]{\left[\begin{array}{r}#1 \\ #2 \\ #3 \\ #4 \end{array}\right]}\) \(\newcommand{\cfourvec}[4]{\left[\begin{array}{c}#1 \\ #2 \\ #3 \\ #4 \end{array}\right]}\) \(\newcommand{\fivevec}[5]{\left[\begin{array}{r}#1 \\ #2 \\ #3 \\ #4 \\ #5 \\ \end{array}\right]}\) \(\newcommand{\cfivevec}[5]{\left[\begin{array}{c}#1 \\ #2 \\ #3 \\ #4 \\ #5 \\ \end{array}\right]}\) \(\newcommand{\mattwo}[4]{\left[\begin{array}{rr}#1 \amp #2 \\ #3 \amp #4 \\ \end{array}\right]}\) \(\newcommand{\laspan}[1]{\text{Span}\{#1\}}\) \(\newcommand{\bcal}{\cal B}\) \(\newcommand{\ccal}{\cal C}\) \(\newcommand{\scal}{\cal S}\) \(\newcommand{\wcal}{\cal W}\) \(\newcommand{\ecal}{\cal E}\) \(\newcommand{\coords}[2]{\left\{#1\right\}_{#2}}\) \(\newcommand{\gray}[1]{\color{gray}{#1}}\) \(\newcommand{\lgray}[1]{\color{lightgray}{#1}}\) \(\newcommand{\rank}{\operatorname{rank}}\) \(\newcommand{\row}{\text{Row}}\) \(\newcommand{\col}{\text{Col}}\) \(\renewcommand{\row}{\text{Row}}\) \(\newcommand{\nul}{\text{Nul}}\) \(\newcommand{\var}{\text{Var}}\) \(\newcommand{\corr}{\text{corr}}\) \(\newcommand{\len}[1]{\left|#1\right|}\) \(\newcommand{\bbar}{\overline{\bvec}}\) \(\newcommand{\bhat}{\widehat{\bvec}}\) \(\newcommand{\bperp}{\bvec^\perp}\) \(\newcommand{\xhat}{\widehat{\xvec}}\) \(\newcommand{\vhat}{\widehat{\vvec}}\) \(\newcommand{\uhat}{\widehat{\uvec}}\) \(\newcommand{\what}{\widehat{\wvec}}\) \(\newcommand{\Sighat}{\widehat{\Sigma}}\) \(\newcommand{\lt}{<}\) \(\newcommand{\gt}{>}\) \(\newcommand{\amp}{&}\) \(\definecolor{fillinmathshade}{gray}{0.9}\)Learning Outcomes
- Interpret bar charts using fractions, decimals and percents
- Interpret pie charts using fractions, decimals and percents
Charts, such as bar charts and pie charts are visual ways of presenting data. You can think of each slice of the pie or each bar as a part of the whole. The numerical versions of this are a list of fractions, decimals and percents. By the end of this section we will be able to look at one of these charts and produce the corresponding fractions, decimals, and percents.
Reading a Bar Chart
Bar charts occur frequently and it is definitely required to understand how to read them and interpret them in statistics. Often we want to convert the information of a bar chart to information shown numerically. We need fractions and/or percents to do this.
Example \(\PageIndex{1}\)
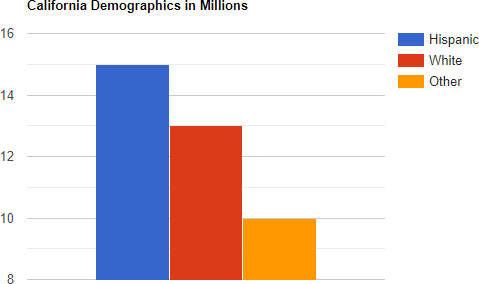
The above bar chart shows the demographics of California in 2019 where the numbers represent millions of people. Here are some questions that might come up in a statistics class.
- What fraction of Californians was Hispanic in 2019?
- What proportion of all Californians was White in 2019? Write your answer as a decimal number rounded to four decimal places.
- What percent of Californians who were neither Hispanic nor White in 2019? Round your answer to the nearest percent.
Solution
- To find the fraction of California that was Hispanic in 2019, the numerator will be the total number of Hispanics and the denominator will be the total number of people in California in 2019. The height of the bar that represents Hispanics is 15. Therefore the numerator is 15. To find the total number of people in California, we add up the heights of the three bars:
\[15+13+10\:=\:38 \nonumber \]
Now we can just write down the fraction:
\[\frac{15}{38} \nonumber \]To find the proportion of Californians who were White in 2019, we start in the same way. The numerator will be the number of Whites: 13. The denominator will be the total number of Californians which we already computed as 38. Therefore the fraction of Californians who were White is:
\[\frac{13}{38} \nonumber \] To convert this to a decimal, we use a calculator to get:
\[\frac{13}{38}\approx0.342105 \nonumber \]Next round to four decimal places. Since the digit to the right of the fourth decimal place is \(0\:<5\), we round down to:
\[0.3421 \nonumber \] - To find the percent of Californians who were neither Hispanic nor White in 2019, we first find the fraction who were neither. The numerator will be the number of "Other" which is: 10. The denominator will be the total which is 38. Thus the fraction is: \[\frac{10}{38} \nonumber \] Next, use a calculator to divide these numbers to get: \[\frac{10}{38}\approx0.263158 \nonumber \] To convert this to a percent we multiply by 100% by moving the decimal two places to the right: \[0.263158\:\times100\%\:=\:26.3158\% \nonumber \] Finally we round to the nearest whole number. Noting that \(3 < 5\), we round down to get: 26%
Exercise
The bar chart below shows the grade distribution for a math class.
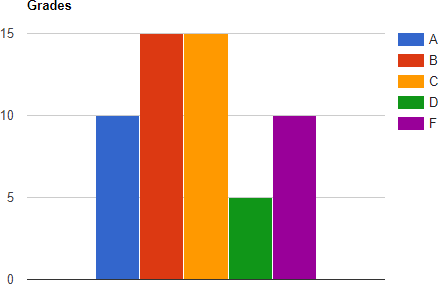
- Find the fraction of students who received a "C" grade.
- Find the proportion of grades below a "C". Write your answer as a decimal number rounded to the nearest hundredth.
- What percent of the students received an "A" grade? Round your answer to the nearest whole number percent.
Reading a Pie Chart
Another important chart that is used to display the components of a whole is a pie chart. With a pie chart, it is very easy to determine the percent of each item.
Example \(\PageIndex{2}\)
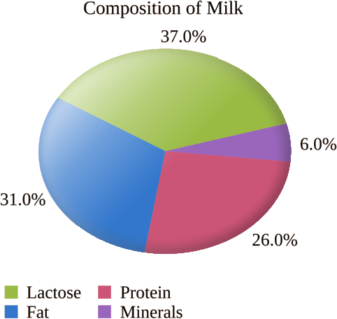
The pie chart below shows the makeup of milk. Write the proportion of fat contained in milk as a decimal.
Solution
We see that 31% of milk is fat. To convert a percent to a decimal, we just move the decimal over two places to the left. Thus, 31% becomes 0.31.
Example \(\PageIndex{3}\)
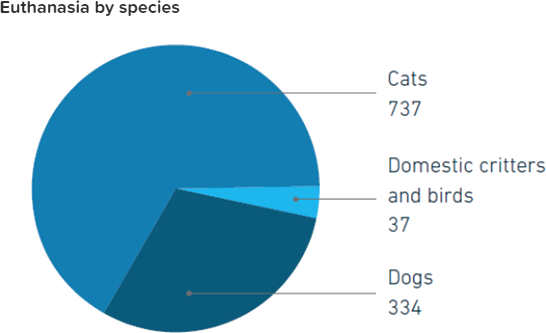
The pie chart above shows the number of pets of each type that had to be euthanized by the humane society due to incurable illnesses.
- What fraction of the euthanized pets were dogs?
- What percent of the euthanized pets were cats? Round to the nearest whole number percent.
Solution
- We take the number of dogs over the total. There were 334 euthanized dogs. To find the total we add: \[737+37+334\:=\:1108 \nonumber \]
Therefore, the fraction of euthanized dogs is \[\frac{334}{1108} \nonumber \] - To find the percent of euthanized cats, we first find the fraction. There were 737 cats over a total of 1108 pets. The fraction is \[\frac{737}{1108} \nonumber \]
Next use a calculator to get the decimal number: 0.66516. Now multiply by 100% by moving the decimal place two digits to the right to get: 66.516%. Finally, we need to round to the nearest whole number percent. Since \(5\ge\:5\), we round up. Thus the percent of euthanized cats is 67%.