
Ch 2.5 and 2.6 Measure of Center and Skewness
- Page ID
- 15884
\( \newcommand{\vecs}[1]{\overset { \scriptstyle \rightharpoonup} {\mathbf{#1}} } \)
\( \newcommand{\vecd}[1]{\overset{-\!-\!\rightharpoonup}{\vphantom{a}\smash {#1}}} \)
\( \newcommand{\id}{\mathrm{id}}\) \( \newcommand{\Span}{\mathrm{span}}\)
( \newcommand{\kernel}{\mathrm{null}\,}\) \( \newcommand{\range}{\mathrm{range}\,}\)
\( \newcommand{\RealPart}{\mathrm{Re}}\) \( \newcommand{\ImaginaryPart}{\mathrm{Im}}\)
\( \newcommand{\Argument}{\mathrm{Arg}}\) \( \newcommand{\norm}[1]{\| #1 \|}\)
\( \newcommand{\inner}[2]{\langle #1, #2 \rangle}\)
\( \newcommand{\Span}{\mathrm{span}}\)
\( \newcommand{\id}{\mathrm{id}}\)
\( \newcommand{\Span}{\mathrm{span}}\)
\( \newcommand{\kernel}{\mathrm{null}\,}\)
\( \newcommand{\range}{\mathrm{range}\,}\)
\( \newcommand{\RealPart}{\mathrm{Re}}\)
\( \newcommand{\ImaginaryPart}{\mathrm{Im}}\)
\( \newcommand{\Argument}{\mathrm{Arg}}\)
\( \newcommand{\norm}[1]{\| #1 \|}\)
\( \newcommand{\inner}[2]{\langle #1, #2 \rangle}\)
\( \newcommand{\Span}{\mathrm{span}}\) \( \newcommand{\AA}{\unicode[.8,0]{x212B}}\)
\( \newcommand{\vectorA}[1]{\vec{#1}} % arrow\)
\( \newcommand{\vectorAt}[1]{\vec{\text{#1}}} % arrow\)
\( \newcommand{\vectorB}[1]{\overset { \scriptstyle \rightharpoonup} {\mathbf{#1}} } \)
\( \newcommand{\vectorC}[1]{\textbf{#1}} \)
\( \newcommand{\vectorD}[1]{\overrightarrow{#1}} \)
\( \newcommand{\vectorDt}[1]{\overrightarrow{\text{#1}}} \)
\( \newcommand{\vectE}[1]{\overset{-\!-\!\rightharpoonup}{\vphantom{a}\smash{\mathbf {#1}}}} \)
\( \newcommand{\vecs}[1]{\overset { \scriptstyle \rightharpoonup} {\mathbf{#1}} } \)
\( \newcommand{\vecd}[1]{\overset{-\!-\!\rightharpoonup}{\vphantom{a}\smash {#1}}} \)
\(\newcommand{\avec}{\mathbf a}\) \(\newcommand{\bvec}{\mathbf b}\) \(\newcommand{\cvec}{\mathbf c}\) \(\newcommand{\dvec}{\mathbf d}\) \(\newcommand{\dtil}{\widetilde{\mathbf d}}\) \(\newcommand{\evec}{\mathbf e}\) \(\newcommand{\fvec}{\mathbf f}\) \(\newcommand{\nvec}{\mathbf n}\) \(\newcommand{\pvec}{\mathbf p}\) \(\newcommand{\qvec}{\mathbf q}\) \(\newcommand{\svec}{\mathbf s}\) \(\newcommand{\tvec}{\mathbf t}\) \(\newcommand{\uvec}{\mathbf u}\) \(\newcommand{\vvec}{\mathbf v}\) \(\newcommand{\wvec}{\mathbf w}\) \(\newcommand{\xvec}{\mathbf x}\) \(\newcommand{\yvec}{\mathbf y}\) \(\newcommand{\zvec}{\mathbf z}\) \(\newcommand{\rvec}{\mathbf r}\) \(\newcommand{\mvec}{\mathbf m}\) \(\newcommand{\zerovec}{\mathbf 0}\) \(\newcommand{\onevec}{\mathbf 1}\) \(\newcommand{\real}{\mathbb R}\) \(\newcommand{\twovec}[2]{\left[\begin{array}{r}#1 \\ #2 \end{array}\right]}\) \(\newcommand{\ctwovec}[2]{\left[\begin{array}{c}#1 \\ #2 \end{array}\right]}\) \(\newcommand{\threevec}[3]{\left[\begin{array}{r}#1 \\ #2 \\ #3 \end{array}\right]}\) \(\newcommand{\cthreevec}[3]{\left[\begin{array}{c}#1 \\ #2 \\ #3 \end{array}\right]}\) \(\newcommand{\fourvec}[4]{\left[\begin{array}{r}#1 \\ #2 \\ #3 \\ #4 \end{array}\right]}\) \(\newcommand{\cfourvec}[4]{\left[\begin{array}{c}#1 \\ #2 \\ #3 \\ #4 \end{array}\right]}\) \(\newcommand{\fivevec}[5]{\left[\begin{array}{r}#1 \\ #2 \\ #3 \\ #4 \\ #5 \\ \end{array}\right]}\) \(\newcommand{\cfivevec}[5]{\left[\begin{array}{c}#1 \\ #2 \\ #3 \\ #4 \\ #5 \\ \end{array}\right]}\) \(\newcommand{\mattwo}[4]{\left[\begin{array}{rr}#1 \amp #2 \\ #3 \amp #4 \\ \end{array}\right]}\) \(\newcommand{\laspan}[1]{\text{Span}\{#1\}}\) \(\newcommand{\bcal}{\cal B}\) \(\newcommand{\ccal}{\cal C}\) \(\newcommand{\scal}{\cal S}\) \(\newcommand{\wcal}{\cal W}\) \(\newcommand{\ecal}{\cal E}\) \(\newcommand{\coords}[2]{\left\{#1\right\}_{#2}}\) \(\newcommand{\gray}[1]{\color{gray}{#1}}\) \(\newcommand{\lgray}[1]{\color{lightgray}{#1}}\) \(\newcommand{\rank}{\operatorname{rank}}\) \(\newcommand{\row}{\text{Row}}\) \(\newcommand{\col}{\text{Col}}\) \(\renewcommand{\row}{\text{Row}}\) \(\newcommand{\nul}{\text{Nul}}\) \(\newcommand{\var}{\text{Var}}\) \(\newcommand{\corr}{\text{corr}}\) \(\newcommand{\len}[1]{\left|#1\right|}\) \(\newcommand{\bbar}{\overline{\bvec}}\) \(\newcommand{\bhat}{\widehat{\bvec}}\) \(\newcommand{\bperp}{\bvec^\perp}\) \(\newcommand{\xhat}{\widehat{\xvec}}\) \(\newcommand{\vhat}{\widehat{\vvec}}\) \(\newcommand{\uhat}{\widehat{\uvec}}\) \(\newcommand{\what}{\widehat{\wvec}}\) \(\newcommand{\Sighat}{\widehat{\Sigma}}\) \(\newcommand{\lt}{<}\) \(\newcommand{\gt}{>}\) \(\newcommand{\amp}{&}\) \(\definecolor{fillinmathshade}{gray}{0.9}\)Ch 2.5 and 2.6 Measure of Center and skewness
Center: A measure of center is a value at the center or middle of a data set. It is used to provide a representative value that “summarize” the data.
Measure of center: (mean, median, mode, midrange)
1) Mean: the average of the data.
sample mean \(\bar {x} = \frac{\sum{x}}{n} \) ; n = sample size, \(\bar{x} \) is read as x-bar,
population mean \(\mu = \frac{\sum{x}}{N} \) ; N = population size, \(\mu \) is read as mu, a greek letter.
*the term “average” is not used by statistician.
Important properties of mean:
a) Use every data value (in a sample or population)
b) Extreme value can change the value of mean substantially. Mean is not resistance.
c) \(\bar{x} \) can be used to estimate μ if sample is representative and not bias.
If the sample is voluntary response or biased \(\bar{x} \) will not be a good estimate of μ.
Ex1: Mean of 78, 89, 75, 92, 66, 82 is 80.3
Mean of 78, 89, 75, 92, 66, 82, 5 is 69.6 (not middle)
Ex2: Mean of top 5 scores: 90, 95, 92, 98, 89;
\( \bar{x} \) is 92.8 but is not a good estimate for the whole class mean because the sample is bias, not from random selection.
2) Median: the middle value when the data are arranged in order of increasing or decreasing magnitude.
How to calculate the median:
a) Sort the values
b) Odd number of values: Median is the middle one
Even number of values: Median is the mean of the middle two values.
Properties of Median:
a) The median does not change when we add a few extreme values. It is resistance.
b) Median does not use every value.
Ex1: Median of 78, 89, 75, 92, 66, 82 is 80
Median of 78, 89, 75, 92, 66, 82, 5 is 78 (middle)
3) Mode: the value (s) that occur(s) with the greatest frequency. Can be calculated for qualitative data. Not common for quantitative continuous data.
Properties of mode:
a) Data can have one, two, multiple or no modes.
b) Bimodal – two data values occur with same greatest frequency.
c) Multimodal – more than two data values occur with the same greatest frequency.
d) No mode – no data value is repeated.
4) Midrange: the value that is midway between the maximum and minimum values in the dataset.
\(midrange = \frac{\text{maximum + minimum}}{2} \)
Properties of Midrange:
a) Not resistance to extreme values.
b) Easy to compute but rarely used.
c) Midrange does not use all data. It is not the median and it is not half of range.
Find Mean, median, and midrange by technology:
Use Libretexts online calculator. Link to one variable statistics calculator
Input data separated by commas , check population standard deviation or sample standard deviation, and click calculate.
Find mode by technology
Use online calculator: (for multiple mode)
https://www.calculatorsoup.com/calculators/statistics/mean-median-mode.php
Input data to the window, click Calculate.
Round off rules:
a) Mean, median and Midrange: carry one more decimal place than original data.
b) Mode: leave the value as is without rounding.
Ex1. Find the mean, median, midrange, mode of the length of boats (in ft) parked in a marina.
16, 17, 19, 20, 20, 21, 23, 24, 25, 25, 25, 26, 26, 27, 27,27, 28, 29, 30, 32, 33, 33, 34, 35, 37, 39, 40
a) Find the mean, median, mode and midrange.
Which of the above is the best measure of center?
b) Can this mean be used to estimate mean length of all boats in all marina? Explain.
a) Use Libretexts Online Statistics calculator. and online mode calculator.
Mean = 27.3, Median = 27, min = 16, max = 40
Midrange = (16 + 40)/2 = 28, Mode = 25 and 27.
Mean is a better choice because data is symmetrical and there are no outliers in the data.
b) This mean is not representative because the sample is from one marina only.
Ex. 2 Which is the greatest, mean, median or mode?
11, 11, 12, 12, 12, 12, 13, 15,17, 22, 22, 22
Use Libretexts Online Statistics calculator. and online mode calculator.
Mean = 15.1
Median =12.5
Mode = 12
Midrange = 16.5
Mean, median and skewness:
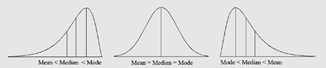
Choose the best measure of center:
a) Use mode for nominal data as center.
b) Use mean if there is no extreme data.
c) Use median if extreme data exist.
d) Use median if data is skewed.
Find mean from a frequency distribution:
grouped mean \(\bar {x} = \frac{\sum{f * x}}{\sum{f}} \) ; is the mean from GFDT where
x is the class midpoint of each class.
f is the frequency of each class
Find grouped-mean for GFDT by technology: Libretexts Online Calculator
- - Enter lower limit to lower bounds, upper limit to upper bounds, enter frequencies for each row in the GFDT.
- - Scroll to the bottom and click calculate.
Ex1. Find grouped mean from GFDT:
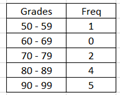
Enter the table to Libretexts Online calculator , calculate.
Ans: mean = 84.5
Ex2. Find the mean, median from the data in the histogram.
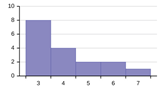
Write the frequency table by reading the classes and frequencies from the histogram as below:
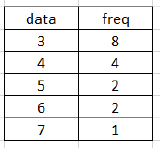 Enter the table to Libretexts Online calculator , calculate.
Ans: mean = 4.06, median = 4
Note: when data is extremely skewed in a particular way, the mean and median can be the same.