
13.4: Wilcoxon Signed-Rank Test
- Page ID
- 24083

\( \newcommand{\vecs}[1]{\overset { \scriptstyle \rightharpoonup} {\mathbf{#1}} } \)
\( \newcommand{\vecd}[1]{\overset{-\!-\!\rightharpoonup}{\vphantom{a}\smash {#1}}} \)
\( \newcommand{\dsum}{\displaystyle\sum\limits} \)
\( \newcommand{\dint}{\displaystyle\int\limits} \)
\( \newcommand{\dlim}{\displaystyle\lim\limits} \)
\( \newcommand{\id}{\mathrm{id}}\) \( \newcommand{\Span}{\mathrm{span}}\)
( \newcommand{\kernel}{\mathrm{null}\,}\) \( \newcommand{\range}{\mathrm{range}\,}\)
\( \newcommand{\RealPart}{\mathrm{Re}}\) \( \newcommand{\ImaginaryPart}{\mathrm{Im}}\)
\( \newcommand{\Argument}{\mathrm{Arg}}\) \( \newcommand{\norm}[1]{\| #1 \|}\)
\( \newcommand{\inner}[2]{\langle #1, #2 \rangle}\)
\( \newcommand{\Span}{\mathrm{span}}\)
\( \newcommand{\id}{\mathrm{id}}\)
\( \newcommand{\Span}{\mathrm{span}}\)
\( \newcommand{\kernel}{\mathrm{null}\,}\)
\( \newcommand{\range}{\mathrm{range}\,}\)
\( \newcommand{\RealPart}{\mathrm{Re}}\)
\( \newcommand{\ImaginaryPart}{\mathrm{Im}}\)
\( \newcommand{\Argument}{\mathrm{Arg}}\)
\( \newcommand{\norm}[1]{\| #1 \|}\)
\( \newcommand{\inner}[2]{\langle #1, #2 \rangle}\)
\( \newcommand{\Span}{\mathrm{span}}\) \( \newcommand{\AA}{\unicode[.8,0]{x212B}}\)
\( \newcommand{\vectorA}[1]{\vec{#1}} % arrow\)
\( \newcommand{\vectorAt}[1]{\vec{\text{#1}}} % arrow\)
\( \newcommand{\vectorB}[1]{\overset { \scriptstyle \rightharpoonup} {\mathbf{#1}} } \)
\( \newcommand{\vectorC}[1]{\textbf{#1}} \)
\( \newcommand{\vectorD}[1]{\overrightarrow{#1}} \)
\( \newcommand{\vectorDt}[1]{\overrightarrow{\text{#1}}} \)
\( \newcommand{\vectE}[1]{\overset{-\!-\!\rightharpoonup}{\vphantom{a}\smash{\mathbf {#1}}}} \)
\( \newcommand{\vecs}[1]{\overset { \scriptstyle \rightharpoonup} {\mathbf{#1}} } \)
\(\newcommand{\longvect}{\overrightarrow}\)
\( \newcommand{\vecd}[1]{\overset{-\!-\!\rightharpoonup}{\vphantom{a}\smash {#1}}} \)
\(\newcommand{\avec}{\mathbf a}\) \(\newcommand{\bvec}{\mathbf b}\) \(\newcommand{\cvec}{\mathbf c}\) \(\newcommand{\dvec}{\mathbf d}\) \(\newcommand{\dtil}{\widetilde{\mathbf d}}\) \(\newcommand{\evec}{\mathbf e}\) \(\newcommand{\fvec}{\mathbf f}\) \(\newcommand{\nvec}{\mathbf n}\) \(\newcommand{\pvec}{\mathbf p}\) \(\newcommand{\qvec}{\mathbf q}\) \(\newcommand{\svec}{\mathbf s}\) \(\newcommand{\tvec}{\mathbf t}\) \(\newcommand{\uvec}{\mathbf u}\) \(\newcommand{\vvec}{\mathbf v}\) \(\newcommand{\wvec}{\mathbf w}\) \(\newcommand{\xvec}{\mathbf x}\) \(\newcommand{\yvec}{\mathbf y}\) \(\newcommand{\zvec}{\mathbf z}\) \(\newcommand{\rvec}{\mathbf r}\) \(\newcommand{\mvec}{\mathbf m}\) \(\newcommand{\zerovec}{\mathbf 0}\) \(\newcommand{\onevec}{\mathbf 1}\) \(\newcommand{\real}{\mathbb R}\) \(\newcommand{\twovec}[2]{\left[\begin{array}{r}#1 \\ #2 \end{array}\right]}\) \(\newcommand{\ctwovec}[2]{\left[\begin{array}{c}#1 \\ #2 \end{array}\right]}\) \(\newcommand{\threevec}[3]{\left[\begin{array}{r}#1 \\ #2 \\ #3 \end{array}\right]}\) \(\newcommand{\cthreevec}[3]{\left[\begin{array}{c}#1 \\ #2 \\ #3 \end{array}\right]}\) \(\newcommand{\fourvec}[4]{\left[\begin{array}{r}#1 \\ #2 \\ #3 \\ #4 \end{array}\right]}\) \(\newcommand{\cfourvec}[4]{\left[\begin{array}{c}#1 \\ #2 \\ #3 \\ #4 \end{array}\right]}\) \(\newcommand{\fivevec}[5]{\left[\begin{array}{r}#1 \\ #2 \\ #3 \\ #4 \\ #5 \\ \end{array}\right]}\) \(\newcommand{\cfivevec}[5]{\left[\begin{array}{c}#1 \\ #2 \\ #3 \\ #4 \\ #5 \\ \end{array}\right]}\) \(\newcommand{\mattwo}[4]{\left[\begin{array}{rr}#1 \amp #2 \\ #3 \amp #4 \\ \end{array}\right]}\) \(\newcommand{\laspan}[1]{\text{Span}\{#1\}}\) \(\newcommand{\bcal}{\cal B}\) \(\newcommand{\ccal}{\cal C}\) \(\newcommand{\scal}{\cal S}\) \(\newcommand{\wcal}{\cal W}\) \(\newcommand{\ecal}{\cal E}\) \(\newcommand{\coords}[2]{\left\{#1\right\}_{#2}}\) \(\newcommand{\gray}[1]{\color{gray}{#1}}\) \(\newcommand{\lgray}[1]{\color{lightgray}{#1}}\) \(\newcommand{\rank}{\operatorname{rank}}\) \(\newcommand{\row}{\text{Row}}\) \(\newcommand{\col}{\text{Col}}\) \(\renewcommand{\row}{\text{Row}}\) \(\newcommand{\nul}{\text{Nul}}\) \(\newcommand{\var}{\text{Var}}\) \(\newcommand{\corr}{\text{corr}}\) \(\newcommand{\len}[1]{\left|#1\right|}\) \(\newcommand{\bbar}{\overline{\bvec}}\) \(\newcommand{\bhat}{\widehat{\bvec}}\) \(\newcommand{\bperp}{\bvec^\perp}\) \(\newcommand{\xhat}{\widehat{\xvec}}\) \(\newcommand{\vhat}{\widehat{\vvec}}\) \(\newcommand{\uhat}{\widehat{\uvec}}\) \(\newcommand{\what}{\widehat{\wvec}}\) \(\newcommand{\Sighat}{\widehat{\Sigma}}\) \(\newcommand{\lt}{<}\) \(\newcommand{\gt}{>}\) \(\newcommand{\amp}{&}\) \(\definecolor{fillinmathshade}{gray}{0.9}\)The Wilcoxon Signed-Rank Sum test is the non-parametric alternative to the dependent t-test. The Wilcoxon Signed-Rank Sum test compares the medians of two dependent distributions. The Signed-Rank Sum test, developed by Frank Wilcoxon, finds the difference between paired data values and ranks the absolute value of the differences. Then we sum the ranks for all the negative and positive differences separately. The absolute value of the smaller of these summed ranks is called \(w_{s}\). If there were any differences of zero you would not count them in your sample size.

When the sample size is less than 30, the test statistic is \(w_{s}\), the absolute value of the smaller of the sum of ranks. Figure 13-5 provides critical values for the Wilcoxon Signed-Rank test. If the test statistic \(w_{s}\) is greater than the critical value from the table, we fail to reject \(H_{0}\). If the test statistic \(w_{s}\) is less than or equal to the critical value from the table, we reject \(H_{0}\).
| 1-Tailed \(\alpha\) | 2-Tailed \(\alpha\) | ||||||
|---|---|---|---|---|---|---|---|
| \(n\) | 0.01 | 0.05 | 0.10 | 0.01 | 0.05 | 0.10 | |
| 5 | - | 0 | 2 | - | - | 0 | |
| 6 | - | 2 | 3 | - | 0 | 2 | |
| 7 | 0 | 3 | 5 | - | 2 | 3 | |
| 8 | 1 | 5 | 8 | 0 | 3 | 5 | |
| 9 | 3 | 8 | 10 | 1 | 5 | 8 | |
| 10 | 5 | 10 | 14 | 3 | 8 | 10 | |
| 11 | 7 | 13 | 17 | 5 | 10 | 13 | |
| 12 | 9 | 17 | 21 | 7 | 13 | 17 | |
| 13 | 12 | 21 | 26 | 9 | 17 | 21 | |
| 14 | 15 | 25 | 31 | 12 | 21 | 25 | |
| 15 | 19 | 30 | 36 | 15 | 25 | 30 | |
| 16 | 23 | 35 | 42 | 19 | 29 | 35 | |
| 17 | 27 | 41 | 48 | 23 | 34 | 41 | |
| 18 | 32 | 47 | 55 | 27 | 40 | 47 | |
| 19 | 37 | 53 | 62 | 32 | 46 | 53 | |
| 20 | 43 | 60 | 69 | 37 | 52 | 60 | |
| 21 | 49 | 67 | 77 | 42 | 58 | 67 | |
| 22 | 55 | 75 | 86 | 48 | 65 | 75 | |
| 23 | 62 | 83 | 94 | 54 | 73 | 83 | |
| 24 | 69 | 91 | 104 | 61 | 81 | 91 | |
| 25 | 76 | 100 | 113 | 68 | 89 | 100 | |
| 26 | 84 | 110 | 124 | 75 | 98 | 110 | |
| 27 | 92 | 119 | 134 | 83 | 107 | 119 | |
| 28 | 101 | 130 | 145 | 91 | 116 | 130 | |
| 29 | 110 | 140 | 157 | 100 | 126 | 140 | |
In an effort to increase production of an automobile part, the factory manager decides to play music in the manufacturing area. Eight workers are selected, and the number of items each produced for a specific day is recorded. After one week of music, the same workers are monitored again. The data are given in the table. At \(\alpha = 0.05\), can the manager conclude that listening to music has increased production? Use the Wilcoxon Signed-Rank Test since there is no mention of the population being normally distributed.
Worker 1 2 3 4 5 6 7 8 9
Before 6 8 10 9 5 12 9 5 7
After 10 12 9 12 8 13 8 5 10
Solution
The correct hypotheses are:
\(H_{0}\): Music in the manufacturing area does not increase production.
\(H_{1}\): Music in the manufacturing area increases production.
This is a left-tailed test.
In order to compute the t-test statistic, first compute the differences between each of the matched pairs.
| Before \((x_{1})\) | 6 | 8 | 10 | 9 | 5 | 12 | 9 | 5 | 7 |
|---|---|---|---|---|---|---|---|---|---|
| After \((x_{2})\) | 10 | 12 | 9 | 12 | 8 | 13 | 8 | 5 | 10 |
| \(D = x_{1} - x_{2}\) | –4 | –4 | 1 | –3 | –3 | –1 | 1 | 0 | –3 |
Take the absolute value of each difference.
| Before \((x_{1})\) | 6 | 8 | 10 | 9 | 5 | 12 | 9 | 5 | 7 |
|---|---|---|---|---|---|---|---|---|---|
| After \((x_{2})\) | 10 | 12 | 9 | 12 | 8 | 13 | 8 | 5 | 10 |
| \(D = x_{1} - x_{2}\) | –4 | –4 | 1 | –3 | –3 | –1 | 1 | 0 | –3 |
| \(|D|\) | 4 | 4 | 1 | 3 | 3 | 1 | 1 | 0 | 3 |
Rank the data and drop any ties. At this point, if any of the differences are zero, that pair is no longer used and is not ranked.
| Before \((x_{1})\) | 6 | 8 | 10 | 9 | 5 | 12 | 9 | 5 | 7 |
|---|---|---|---|---|---|---|---|---|---|
| After \((x_{2})\) | 10 | 12 | 9 | 12 | 8 | 13 | 8 | 5 | 10 |
| \(D = x_{1} - x_{2}\) | –4 | –4 | 1 | –3 | –3 | –1 | 1 | 0 | –3 |
| \(|D|\) | 4 | 4 | 1 | 3 | 3 | 1 | 1 | 0 | 3 |
| Rank | 7.5 | 7.5 | 2 | 5 | 5 | 2 | 2 | drop | 5 |
The sample size \(n\) is the number of differences that are not zero. So, in this case, \(n = 8\). Next, take the sign of the difference and attach this plus or minus sign to each rank.
| Before \((x_{1})\) | 6 | 8 | 10 | 9 | 5 | 12 | 9 | 7 |
|---|---|---|---|---|---|---|---|---|
| After \((x_{2})\) | 10 | 12 | 9 | 12 | 8 | 13 | 8 | 10 |
| \(D = x_{1} - x_{2}\) | –4 | –4 | 1 | –3 | –3 | –1 | 1 | –3 |
| \(|D|\) | 4 | 4 | 1 | 3 | 3 | 1 | 1 | 3 |
| Rank | 7.5 | 7.5 | 2 | 5 | 5 | 2 | 2 | 5 |
| Signed Rank | –7.5 | –7.5 | +2 | –5 | –5 | -2 | +2 | –5 |
Find the sum of the positive and negative ranks:
Positive ranks: \(2 + 2 = 4\)
Negative ranks: \((-7.5) + (-7.5) + (-5) + (-5) + (-2) + (-5) = -32\).
Take the smaller of the absolute value of the sums of the ranks: \(|4| = 4, |-32| = 32\), so 4 is smaller.
This is our test statistic called \(w_{s} = 4\).
Next, use the table in Figure 13-5 to get the critical value. The table provides critical values for two-tailed tests.
This is a one-tailed test, with \(\alpha = 0.05\) and \(n = 8\). See Figure 13-6 that shows which row and column from Figure 13- 5 to use to find the critical value.
| 1-Tailed \(\alpha\) | |||
|---|---|---|---|
| \(n\) | 0.01 | 0.05 | 0.10 |
| 5 | - | 0 | 2 |
| 6 | - | 2 | 3 |
| 7 | 0 | 3 | 5 |
| 8 | 1 | 5 | 8 |
The critical value = 5. The test statistic \(w_{s} = 4\) is less than the critical value of 5.
The decision rule for the critical values in Figure 13-5 is to reject the null if the test statistic is less than or equal to the critical value, and do not reject the null hypothesis if the test statistic is larger than the critical value.
Since \(w_{s} < \text{Critical Value} = 5\), the decision is to reject \(H_{0}\). There is enough evidence to support the claim that listening to music has increased production.
When the sample size is 30 or more,a paired t-test may be used in most situations. However, if your population is heavily skewed or you are using interval data, then use the large sample size normal approximation Wilcoxon Signed-Rank test.
We can use the normal approximation for sample sizes of 30 or more. The formula for the test statistic is: \[z = \frac{\left(w_{s} - \left(\dfrac{n (n+1)}{4}\right) \right)}{\sqrt{\left( \dfrac{n(n+1)(2n+1)}{24} \right)}} \nonumber\]
where \(n\) is the reduced samples size excluding any differences of zero, and \(w_{s}\) is the smaller in absolute value of the signed ranks for a two-tailed test, the sum of the positive ranks for a left-tailed test, or the sum of the negative ranks for a right-tailed test. The sample size \(n\) is the reduced sample size not including any differences of zero.
A pharmaceutical company is testing to see if there is a significant difference in the pain relief for two new pain medications. They randomly assign the two different pain medications for 34 patients with chronic pain and record the pain rating for each patient one hour after each dose. The pain ratings are on a sliding scale from 1 to 10. The results are listed below. Use the Wilcoxon Signed-Rank test to see if there is a significant difference at \(\alpha = 0.05\).
Patient Drug 1 Drug 2 Patient Drug 1 Drug 2 Patient Drug 1 Drug 2 1 2.4 2.5 13 4 6.1 25 4 5.1 2 4.7 3.3 14 2.2 2.9 26 5.5 4.4 3 1.2 5.3 15 2.7 4.3 27 3.6 3.6 4 5.9 5.6 16 2.9 3.3 28 3.8 3.5 5 4.5 5 17 5 5 29 5.4 4.8 6 4 5.3 18 3.1 5.1 30 2.4 3.2 7 2.5 4.6 19 3.3 3.3 31 4.1 2.6 8 3 2.5 20 3 5.9 32 4.5 5.7 9 5 3.4 21 5.4 3.2 33 4 5.8 10 5.8 5.4 22 4.2 5.9 34 6 5 11 1.9 5.1 23 3.6 5.9 12 3.2 4.3 24 2.2 5.6 Solution
Solution
The correct hypotheses are:
\(H_{0}\): There is no difference in the pain scale rating for the two pain medications.
\(H_{1}\): There is a difference in the pain scale rating for the two pain medications.
Compute the differences between each of the matched pairs. Rank the absolute value of the differences. Make sure to average the ranks repeated differences and do not rank any differences of zero. After the differences are ranked, attach this sign of the difference to each rank.
| Patient | Drug 1 | Drug 2 | Difference | \(|D|\) | Rank | Signed Rank |
|---|---|---|---|---|---|---|
| 1 | 2.4 | 2.5 | –0.1 | 0.1 | 1 | –1 |
| 2 | 4.7 | 3.3 | 1.4 | 1.4 | 17 | 17 |
| 3 | 1.2 | 5.3 | –4.1 | 4.1 | 31 | –31 |
| 4 | 5.9 | 5.6 | 0.3 | 0.3 | 2.5 | 2.5 |
| 5 | 4.5 | 5 | –0.5 | 0.5 | 6.5 | –6.5 |
| 6 | 4 | 5.3 | –1.3 | 1.3 | 16 | –16 |
| 7 | 2.5 | 4.6 | –2.1 | 2.1 | 24.5 | –24.5 |
| 8 | 3 | 2.5 | 0.5 | 0.5 | 6.5 | 6.5 |
| 9 | 5 | 3.4 | 1.6 | 1.6 | 19.5 | 19.5 |
| 10 | 5.8 | 5.4 | 0.4 | 0.4 | 4.5 | 4.5 |
| 11 | 1.9 | 5.1 | –3.2 | 3.2 | 29 | –29 |
| 12 | 3.2 | 4.3 | –1.1 | 1.1 | 13 | –13 |
| 13 | 4 | 6.1 | –2.1 | 2.1 | 24.5 | –24.5 |
| 14 | 2.2 | 2.9 | –0.7 | 0.7 | 9 | –9 |
| 15 | 2.7 | 4.3 | –1.6 | 1.6 | 19.5 | –19.5 |
| 16 | 2.9 | 3.3 | –0.4 | 0.4 | 4.5 | –4.5 |
| 17 | 5 | 5 | 0 | |||
| 18 | 3.1 | 5.1 | –2 | 2 | 23 | –23 |
| 19 | 3.3 | 3.3 | 0 | |||
| 20 | 3 | 5.9 | –2.9 | 2.9 | 28 | –28 |
| 21 | 5.4 | 3.2 | 2.2 | 2.2 | 26 | 26 |
| 22 | 4.2 | 5.9 | –1.7 | 1.7 | 21 | –21 |
| 23 | 3.6 | 5.9 | –2.3 | 2.3 | 27 | –27 |
| 24 | 2.2 | 5.6 | –3.4 | 3.4 | 30 | –30 |
| 25 | 4 | 5.1 | –1.1 | 1.1 | 13 | – 13 |
| 26 | 5.5 | 4.4 | 1.1 | 1.1 | 13 | 13 |
| 27 | 3.6 | 3.6 | 0 | |||
| 28 | 3.8 | 3.5 | 0.3 | 0.3 | 2.5 | 2.5 |
| 29 | 5.4 | 4.8 | 0.6 | 0.6 | 8 | 8 |
| 30 | 2.4 | 3.2 | –0.8 | 0.8 | 10 | –10 |
| 31 | 4.1 | 2.6 | 1.5 | 1.5 | 18 | 18 |
| 32 | 4.5 | 5.7 | –1.2 | 1.2 | 15 | –15 |
| 33 | 4 | 5.8 | –1.8 | 1.8 | 22 | –22 |
| 34 | 6 | 5 | 1 | 1 | 11 | 11 |
Find the sum of the positive and negative ranks:
Positive ranks: \(17 + 2.5 + 6.5 + 19.5 + 4.5 + 26 + 13 + 2.5 + 8 + 18 + 11 = 128.5\)
Negative ranks: \((-1) + (-31) + (-6.5) + (-16) + (-24.5) + (-29) + (-13) + (-24.5) + (-9) + (-19.5) + (-4.5) + (-23) + (-28) + (-21) + (-27) + (-30) + (-13) + (-10) + (-15) + (-22) = -367.5\).
Take the smaller of the absolute value of the sums of the ranks: \(|128.5| = 128.5, |-367.5| = 367.5\), so 128.5 is smaller.
The smaller of the absolute value of the sum of the ranks is \(w_{s} = 128.5\).
Throw out the three differences of zero. The sample size is \(n = 31\).
The test statistic is: \(z = \frac{\left(w_{s} - \left(\frac{n(n+1)}{4}\right)\right)}{\sqrt{\left( \frac{n (n+1) (2n+1)}{24}\right) }} = \frac{\left(128.5 - \left( \frac{31 \cdot 32}{4}\right) \right)}{\sqrt{\left( \frac{31 \cdot 32 \cdot 63}{24}\right) }} = \frac{(128.5 - 248)}{\sqrt{(2604)}} = -2.341787\)
Either the \(z\) critical value or p-value method may be used, similar to how we used previous z-tests.
Compute the \(z_{\alpha/2}\) critical values. Draw and label the distribution; see Figure 13-7.
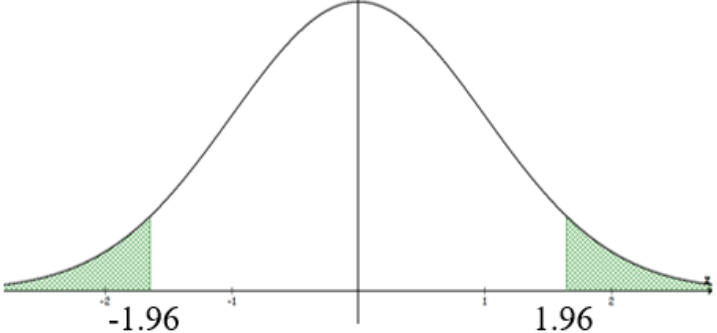.png?revision=1&size=bestfit&width=482&height=224)
Use the inverse normal function \(\text{invNorm}(0.025,0,1)\) to get \(z_{\alpha/2} = \pm 1.96\). The test statistic \(z = -2.3418\) is in the shaded critical region, so reject \(H_{0}\).
There is enough evidence to support the claim that there is a significant difference in the pain scale rating for the two pain medications.
These calculations can be done by hand or using the following online calculator: http://www.socscistatistics.com/tests/signedranks.
The TI calculators and Excel do not have built-in nonparametric tests.
It is an important and popular fact that things are not always what they seem. For instance, on the planet Earth, man had always assumed that he was more intelligent than dolphins because he had achieved so much – the wheel, New York, wars and so on – whilst all the dolphins had ever done was muck about in the water having a good time. But conversely, the dolphins had always believed that they were far more intelligent than man – for precisely the same reasons.
(Adams, 2002)