
1.4: Chapter 1 Exercises
- Page ID
- 24021

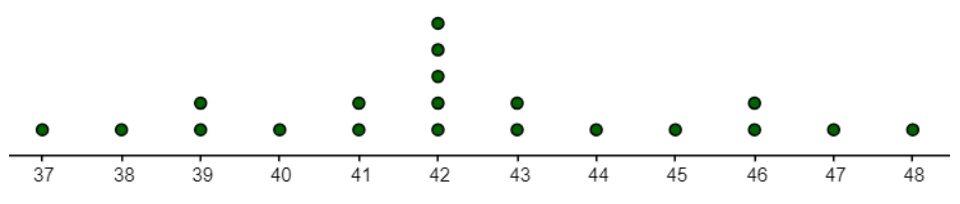
1. The dotplot shows the height of some 5-year-old children measured in inches. Use the distribution of heights to find the approximate answer to the question, “How many inches tall are 5-year-olds?”
“‘Alright,’ he said, ‘but where do we start? How should I know? They say the Ultimate Answer or whatever is Forty‐two, how am I supposed to know what the question is? It could be anything. I mean, what's six times seven?’ Zaphod looked at him hard for a moment. Then his eyes blazed with excitement. ‘Forty-two!’ he cried.” (Adams, 2002)
2. The dotplot shows the height of some 3-year-old children measured in cm. You are asked, “How many cm tall are 3-year-olds?”

- Is this a statistical question?
- Use the distribution of heights to approximate the answer for the question, “How many cm tall are 3-year-olds?”
3. What are statistics?
- A question with a variety of answers.
- A way to measure the entire population.
- The science of collecting, organizing, analyzing and interpreting data.
- A question from a survey.
4. What is a statistical question?
- A question where you expect to get a variety of answers and you are interested in the distribution and tendency of those answers.
- A question using reported statistics.
- A question on a survey.
- A question on a census.
5. Which of the following are statistical questions? Select all that apply.
- How old are you?
- What is the weight of a mouse?
- How tall are all 3-year-olds?
- How tall are you?
- What is the average blood pressure of adult men?
6. In 2010, the Pew Research Center questioned 1,500 adults in the United States to estimate the proportion of the population favoring marijuana use for medical purposes. It was found that 73% are in favor of using marijuana for medical purposes. Identify the individual, variable, population, sample, parameter and statistic.
- Percentage who favor marijuana for medical purposes calculated from sample.
- Set of 1,500 responses of United States adults who are questioned.
- All adults in the United States.
- Percentage who favor marijuana for medical purposes calculated from population.
- The response to the question “should marijuana be used for medical purposes?”
- An adult in the United States.
7. Suppose you want to estimate the percentage of videos on YouTube that are cat videos. It is impossible for you to watch all videos on YouTube so you use a random video picker to select 1,000 videos for you. You find that 2% of these videos are cat videos. Determine which of the following is an observation, a variable, a sample statistic, or a population parameter.
- Percentage of all videos on YouTube that are cat videos.
- A video in your sample.
- 2%
- Whether a video is a cat video.
8. A doctor wants to see if a new treatment for cancer extends the life expectancy of a patient versus the old treatment. She gives one group of 25 cancer patients the new treatment and another group of 25 the old treatment. She then measures the life expectancy of each of the patients. Identify the individual, variable, population, sample, parameter and statistic.
- Cancer patient given the new treatment and cancer patient given the old treatment.
- The two groups of 25 cancer patients given the old and new treatments.
- Average life expectancy of 25 cancer patients given the old treatment and average life expectancy of 25 cancer patients given the new treatment.
- Average life expectancy of all cancer patients given the old and new treatment.
- All cancer patients.
- Life expectancy of the cancer patients.
9. The 2010 General Social Survey asked the question, “After an average workday, about how many hours do you have to relax or pursue activities that you enjoy?” to a random sample of 1,155 Americans. The average relaxing time was found to be 1.65 hours. Determine which of the following is an individual, a variable, a sample statistic, or a population parameter.
- Average number of hours all Americans spend relaxing after an average workday.
- 1.65
- An American in the sample.
- Number of hours spent relaxing after an average workday. 10. In a study, the sample is chosen by dividing the population by gender, and choosing 30 people of each gender. Which sampling method is used?
11. In a study, the sample is chosen by separating all cars by size, and selecting 10 of each size grouping. What is the sampling method?
12. In a study, the sample is chosen by writing everyone’s name on a playing card, shuffling the deck, then choosing the top 20 cards. What is the sampling method?
13. In a study, the sample is chosen by asking people on the street. What is the sampling method?
14. In a study, the sample is chosen by selecting a room of the house, and appraising all items in that room. What is the sampling method?
15. In a study, the sample is chosen by surveying every 3rd driver coming through a tollbooth. What is the sampling method?
16. Researchers collected data to examine the relationship between air pollutants and preterm births in Southern California. During the study air pollution levels were measured by air quality monitoring stations. Specifically, levels of carbon monoxide (CO) were recorded in parts per million, nitrogen dioxide (NO2) and ozone (03) in parts per hundred million, and coarse particulate matter (PM10) in μg/m3 . Length of gestation data were collected on 143,196 births between the years 1989 and 1993, and air pollution exposure during gestation was calculated for each birth. The analysis suggested that increased ambient PM10 and, to a lesser degree, CO concentrations may be associated with the occurrence of preterm births. [B. Ritz et al. “Effect of air pollution on preterm birth among children born in Southern California between 1989 and 1993.” In: Epidemiology 11.5 (2000), pp. 502– 511.] In this study, identify the variables. Select all that apply.
- Ozone
- Carbon Monoxide
- PM10
- Preterm Births in California
- Length of Gestation
- 143,196 Births
- 1989-1993
- Nitrogen Dioxide
17. State whether each study is observational or experimental.
- You want to determine if cinnamon reduces a person’s insulin sensitivity. You give patients who are insulin sensitive a certain amount of cinnamon and then measure their glucose levels.
- A researcher wants to evaluate whether countries with lower fertility rates have a higher life expectancy. They collect the fertility rates and the life expectancies of countries around the world.
- A researcher wants to determine if diet and exercise together helps people lose weight over just exercising. The researcher solicits volunteers to be part of the study, and then randomly assigns the volunteers to be in the diet and exercise group or the exercise only group.
- You collect the weights of tagged fish in a tank. You then put an extra protein fish food in water for the fish and then measure their weight a month later.
18. The Buteyko method is a shallow breathing technique developed by Konstantin Buteyko, a Russian doctor, in 1952. Anecdotal evidence suggests that the Buteyko method can reduce asthma symptoms and improve quality of life. In a scientific study to determine the effectiveness of this method, researchers recruited 600 asthma patients aged 18-69 who relied on medication for asthma treatment. These patients were split into two research groups: one practiced the Buteyko method and the other did not. Patients were scored on quality of life, activity, asthma symptoms, and medication reduction on a scale from 0 to 10. On average, the participants in the Buteyko group experienced a significant reduction in asthma symptoms and an improvement in quality of life. [McGowan. “Health Education: Does the Buteyko Institute Method make a difference?” In: Thorax 58 (2003).] Which of the following is the main research question?
- The Buteyko method causes shallow breathing.
- The Buteyko method can reduce asthma symptoms and an improvement in quality of life.
- Effectiveness of the Buteyko method.
- The patients score on quality of life, activity, asthma symptoms and medication reduction.
19. Researchers studying the relationship between honesty, age and self-control conducted an experiment on 160 children between the ages of 5 and 15. Participants reported their age, sex, and whether they were an only child or not. The researchers asked each child to toss a fair coin in private and to record the outcome (white or black) on a paper sheet, and said they would only reward children who report white. Half the students were explicitly told not to cheat and the others were not given any explicit instructions. In the no instruction group, the probability of cheating was found to be uniform across groups based on child’s characteristics. In the group that was explicitly told to not cheat, girls were less likely to cheat, and while rate of cheating did not vary by age for boys, it decreased with age for girls. [Alessandro Bucciol and Marco Piovesan. “Luck or cheating? A field experiment on honesty with children.” In: Journal of Economic Psychology 32.1 (2011), pp. 73–78.] In this study, identify the variables. Select all that apply.
- Age
- Sex
- Paper Sheet
- Cheated or Not
- Reward for White Side of Coin
- White or Black Side of Coin
- Only Child or Not
20. Select the measurement scale Nominal, Ordinal, Interval or Ratio for each scenario.
- A person’s age.
- A person’s race.
- Age groupings (baby, toddler, adolescent, teenager, adult, elderly).
- Clothing brand.
- A person’s IQ score.
- Temperature in degrees Celsius.
- The amount of mercury in a tuna fish.
21. Select the measurement scale Nominal, Ordinal, Interval or Ratio for each scenario.
- Temperature in degrees Kelvin.
- Eye color.
- Year in school (freshman, sophomore, junior, senior).
- The weight of a hummingbird.
- The height of a building.
- The amount of iron in a person’s blood.
- A person’s gender.
- A person’s race.
22. State which type of variable each is, qualitative or quantitative?
- A person’s age.
- A person’s gender.
- The amount of mercury in a tuna fish.
- The weight of an elephant.
- Temperature in degrees Fahrenheit.
23. State which type of variable each is, qualitative or quantitative?
- The height of a giraffe.
- A person’s race.
- Hair color.
- A person’s ethnicity.
- Year in school (freshman, sophomore, junior, senior).
24. State whether the variable is discrete or continuous.
- A person’s weight.
- The height of a building.
- A person’s age.
- The number of floors of a skyscraper.
- The number of clothing items available for purchase.
25. State whether the variable is discrete or continuous.
- Temperature in degrees Celsius.
- The number of cars for sale at a car dealership.
- The time it takes to run a marathon.
- The amount of mercury in a tuna fish.
- The weight of a hummingbird.
26. State whether each study is cross-sectional, retrospective or prospective.
- To see if there is a link between smoking and bladder cancer, patients with bladder cancer are asked if they currently smoke or if they smoked in the past.
- The Nurses Health Survey was a survey where nurses were asked to record their eating habits over a period of time, and their general health was recorded.
- A new study is underway to track the eating and exercise patterns of people at different time-periods in the future, and see who is afflicted with cancer later in life.
- The prices of generic items are compared to the prices of the equivalent named brand items.
27. Which type of sampling method is used for each scenario, Simple Random Sampling (SRS), Systematic, Stratified, Cluster or Convenience?
- The quality control officer at a manufacturing plant needs to determine what percentage of items in a batch are defective. The officer chooses every 15th batch off the line and counts the number of defective items in each chosen batch.
- The local grocery store lets you survey customers during lunch hour on their preference for a new bottle design for laundry detergent.
- Put all names in a hat and draw a certain number of names out.
- The researcher randomly selects 5 hospitals in the United States then measures the cholesterol level of all the heart attack patients in each of those hospitals.
28. Which type of sampling method is used for each scenario, Simple Random Sampling (SRS), Systematic, Stratified, Cluster or Convenience?
- If you want to calculate the average price of textbooks, you could divide the individuals into groups by major and then conduct simple random samples inside each group.
- Obtain a list of patients who had surgery at a hospital. Divide the patients according to type of surgery. Draw simple random samples from each group.
- You want to measure whether a tree in the forest is infected with bark beetles. Instead of having to walk all over the forest, you divide the forest up into sectors, and then randomly pick the sectors that you will travel to. Then record whether a tree is infected or not for every tree in that sector.
- You select every 3rd customer that comes that orders from your website.
- Answer to Odd Numbered Exercises
-
1) 42
3) c
5) b, c, e
7)
- A question where you expect to get a variety of answers and you are interested in the distribution and tendency of those answers.
- A question using reported statistics.
- A question on a survey.
- A question on a census.
9)
- A question where you expect to get a variety of answers and you are interested in the distribution and tendency of those answers.
- A question using reported statistics.
- A question on a survey.
- A question on a census.
11) Stratified
13) Convenience
15) Systematic
17)
- Experimental
- Observational
- Experimental
- Experimental
19) a, b, d, f, g
21)
- Ratio
- Nominal
- Ordinal
- Ratio
- Ratio
- Ratio
- Nomina
23)
- Quantitative
- Qualitative
- Qualitative
- Qualitative
- Qualitative
25)
- Continuous
- Discrete
- Continuous
- Continuous
- Continuous
27)
- Systematic
- Convenience
- Random
- Cluster