
15.2.7: Chapter 8 Homework
- Page ID
- 28310

\( \newcommand{\vecs}[1]{\overset { \scriptstyle \rightharpoonup} {\mathbf{#1}} } \) \( \newcommand{\vecd}[1]{\overset{-\!-\!\rightharpoonup}{\vphantom{a}\smash {#1}}} \)\(\newcommand{\id}{\mathrm{id}}\) \( \newcommand{\Span}{\mathrm{span}}\) \( \newcommand{\kernel}{\mathrm{null}\,}\) \( \newcommand{\range}{\mathrm{range}\,}\) \( \newcommand{\RealPart}{\mathrm{Re}}\) \( \newcommand{\ImaginaryPart}{\mathrm{Im}}\) \( \newcommand{\Argument}{\mathrm{Arg}}\) \( \newcommand{\norm}[1]{\| #1 \|}\) \( \newcommand{\inner}[2]{\langle #1, #2 \rangle}\) \( \newcommand{\Span}{\mathrm{span}}\) \(\newcommand{\id}{\mathrm{id}}\) \( \newcommand{\Span}{\mathrm{span}}\) \( \newcommand{\kernel}{\mathrm{null}\,}\) \( \newcommand{\range}{\mathrm{range}\,}\) \( \newcommand{\RealPart}{\mathrm{Re}}\) \( \newcommand{\ImaginaryPart}{\mathrm{Im}}\) \( \newcommand{\Argument}{\mathrm{Arg}}\) \( \newcommand{\norm}[1]{\| #1 \|}\) \( \newcommand{\inner}[2]{\langle #1, #2 \rangle}\) \( \newcommand{\Span}{\mathrm{span}}\)\(\newcommand{\AA}{\unicode[.8,0]{x212B}}\)
- State in your own words the 3 important parts of the Central Limit Theorem.
- For women aged 18‐24, systolic blood pressures (in mmHg) are normally distributed with \(\mu=114.8\) and \(\sigma=13.1\)
- Find the probability that a woman aged 18‐24 has systolic blood pressure exceeding 120.
- If 4 women are randomly selected, find the probability that their mean blood pressure exceeds 120.
- If 40 women are randomly selected, find the probability that their mean blood pressure exceeds 120.
- If the pdf for systolic blood pressure did NOT follow a normal distribution, would your answer to part c change? Explain.
- A normally distributed population of package weights has a mean of 63.5 g and a standard deviation of 12.2 g.
- If you sample 1 package, find the probability that the sample mean is over 66 g.
- If you sample 16 packages, find the probability that the sample mean is over 66 g. Compare this answer to part a.
- If you sample 49 packages, find the probability that the sample mean is over 66 g. Compare this answer to parts a and b.
- High Fructose Corn Syrup (HFCS) is a sweetener in food products that is linked to obesity and Type 2 Diabetes. The mean annual consumption in the United States in 2008 of HFCS was 60 lbs with a standard deviation of 20 lbs. Assume the population follows a Normal Distribution.
- In a sample of 16 Americans, what is the probability that the sample mean will exceed 57 pounds of HFCS per year?
- In a sample of 16 Americans, what is the probability that the sample mean will be between 50 and 70 pounds of HFCS per year.
- In a sample of 16 Americans, between what two values would you expect to see 95% of the sample means?
- The completion time (in minutes) for a student to complete a short quiz follows the continuous probability density function shown here, with some areas calculated. It is known that \(\mu=5.3\) minutes and \(\sigma=2.4\) minutes. 40 students take the quiz.
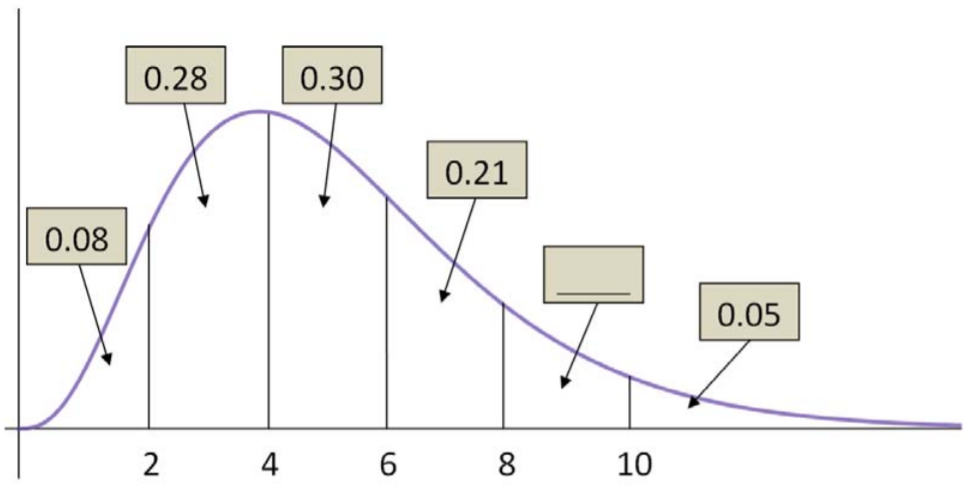
- Find the mean completion time for the students is under 5 minutes.
- Find the probability that the mean time for the class to finish the quiz is between 6 and 8 minutes.
- The mean completion time for the class was 7.1 minutes. Is this result unusual? Explain.
- A pollster sampled 100 adults in California and asked a series of questions. The Central Limit Theorem for Proportions requires that \(np > 10\) and \(n(1‐p) > 10\). Determine if these conditions are met for the following statements.
- 61% of Californians live in Southern California.
- 92% of Californians support Deferred Action for Childhood Arrivals (DACA).
- 24% of Californians have visited Yosemite National Park.
- 8% of Californians have a felony conviction.
- The cycle times for a truck hauling concrete to a highway construction site are uniformly distributed over the interval 50 to 70 minutes. For the Uniform Distribution \(\mu=\dfrac{a+b}{2}\) and \(\sigma=\sqrt{\dfrac{(b-a)^{2}}{12}}\), in which \(a\) is the minimum value and \(b\) is the maximum value.
- Find the mean and standard deviation for cycle times.
- There have been 46 times that concrete has been hauled to the construction site. Find the probability that the mean cycle time for these 46 samples exceeds 58 minutes.
- Nuclear power plants experience serious accidents once every 8 years. Let \(X\) = the waiting time until the next serious accident. X follows an Exponential Distribution in which \(\mu\) = the expected waiting time and \(\sigma=\mu\).
- What is the mean and standard deviation of the random variable X?
- For 35 accidents at nuclear power plants, the mean waiting time was 6.1 years. Is this value unusually low? To answer, find the probability that the mean waiting time is 6.1 years or less.