
4.E: Inferential Theory (Exercises)
- Page ID
- 5454

\( \newcommand{\vecs}[1]{\overset { \scriptstyle \rightharpoonup} {\mathbf{#1}} } \)
\( \newcommand{\vecd}[1]{\overset{-\!-\!\rightharpoonup}{\vphantom{a}\smash {#1}}} \)
\( \newcommand{\dsum}{\displaystyle\sum\limits} \)
\( \newcommand{\dint}{\displaystyle\int\limits} \)
\( \newcommand{\dlim}{\displaystyle\lim\limits} \)
\( \newcommand{\id}{\mathrm{id}}\) \( \newcommand{\Span}{\mathrm{span}}\)
( \newcommand{\kernel}{\mathrm{null}\,}\) \( \newcommand{\range}{\mathrm{range}\,}\)
\( \newcommand{\RealPart}{\mathrm{Re}}\) \( \newcommand{\ImaginaryPart}{\mathrm{Im}}\)
\( \newcommand{\Argument}{\mathrm{Arg}}\) \( \newcommand{\norm}[1]{\| #1 \|}\)
\( \newcommand{\inner}[2]{\langle #1, #2 \rangle}\)
\( \newcommand{\Span}{\mathrm{span}}\)
\( \newcommand{\id}{\mathrm{id}}\)
\( \newcommand{\Span}{\mathrm{span}}\)
\( \newcommand{\kernel}{\mathrm{null}\,}\)
\( \newcommand{\range}{\mathrm{range}\,}\)
\( \newcommand{\RealPart}{\mathrm{Re}}\)
\( \newcommand{\ImaginaryPart}{\mathrm{Im}}\)
\( \newcommand{\Argument}{\mathrm{Arg}}\)
\( \newcommand{\norm}[1]{\| #1 \|}\)
\( \newcommand{\inner}[2]{\langle #1, #2 \rangle}\)
\( \newcommand{\Span}{\mathrm{span}}\) \( \newcommand{\AA}{\unicode[.8,0]{x212B}}\)
\( \newcommand{\vectorA}[1]{\vec{#1}} % arrow\)
\( \newcommand{\vectorAt}[1]{\vec{\text{#1}}} % arrow\)
\( \newcommand{\vectorB}[1]{\overset { \scriptstyle \rightharpoonup} {\mathbf{#1}} } \)
\( \newcommand{\vectorC}[1]{\textbf{#1}} \)
\( \newcommand{\vectorD}[1]{\overrightarrow{#1}} \)
\( \newcommand{\vectorDt}[1]{\overrightarrow{\text{#1}}} \)
\( \newcommand{\vectE}[1]{\overset{-\!-\!\rightharpoonup}{\vphantom{a}\smash{\mathbf {#1}}}} \)
\( \newcommand{\vecs}[1]{\overset { \scriptstyle \rightharpoonup} {\mathbf{#1}} } \)
\(\newcommand{\longvect}{\overrightarrow}\)
\( \newcommand{\vecd}[1]{\overset{-\!-\!\rightharpoonup}{\vphantom{a}\smash {#1}}} \)
\(\newcommand{\avec}{\mathbf a}\) \(\newcommand{\bvec}{\mathbf b}\) \(\newcommand{\cvec}{\mathbf c}\) \(\newcommand{\dvec}{\mathbf d}\) \(\newcommand{\dtil}{\widetilde{\mathbf d}}\) \(\newcommand{\evec}{\mathbf e}\) \(\newcommand{\fvec}{\mathbf f}\) \(\newcommand{\nvec}{\mathbf n}\) \(\newcommand{\pvec}{\mathbf p}\) \(\newcommand{\qvec}{\mathbf q}\) \(\newcommand{\svec}{\mathbf s}\) \(\newcommand{\tvec}{\mathbf t}\) \(\newcommand{\uvec}{\mathbf u}\) \(\newcommand{\vvec}{\mathbf v}\) \(\newcommand{\wvec}{\mathbf w}\) \(\newcommand{\xvec}{\mathbf x}\) \(\newcommand{\yvec}{\mathbf y}\) \(\newcommand{\zvec}{\mathbf z}\) \(\newcommand{\rvec}{\mathbf r}\) \(\newcommand{\mvec}{\mathbf m}\) \(\newcommand{\zerovec}{\mathbf 0}\) \(\newcommand{\onevec}{\mathbf 1}\) \(\newcommand{\real}{\mathbb R}\) \(\newcommand{\twovec}[2]{\left[\begin{array}{r}#1 \\ #2 \end{array}\right]}\) \(\newcommand{\ctwovec}[2]{\left[\begin{array}{c}#1 \\ #2 \end{array}\right]}\) \(\newcommand{\threevec}[3]{\left[\begin{array}{r}#1 \\ #2 \\ #3 \end{array}\right]}\) \(\newcommand{\cthreevec}[3]{\left[\begin{array}{c}#1 \\ #2 \\ #3 \end{array}\right]}\) \(\newcommand{\fourvec}[4]{\left[\begin{array}{r}#1 \\ #2 \\ #3 \\ #4 \end{array}\right]}\) \(\newcommand{\cfourvec}[4]{\left[\begin{array}{c}#1 \\ #2 \\ #3 \\ #4 \end{array}\right]}\) \(\newcommand{\fivevec}[5]{\left[\begin{array}{r}#1 \\ #2 \\ #3 \\ #4 \\ #5 \\ \end{array}\right]}\) \(\newcommand{\cfivevec}[5]{\left[\begin{array}{c}#1 \\ #2 \\ #3 \\ #4 \\ #5 \\ \end{array}\right]}\) \(\newcommand{\mattwo}[4]{\left[\begin{array}{rr}#1 \amp #2 \\ #3 \amp #4 \\ \end{array}\right]}\) \(\newcommand{\laspan}[1]{\text{Span}\{#1\}}\) \(\newcommand{\bcal}{\cal B}\) \(\newcommand{\ccal}{\cal C}\) \(\newcommand{\scal}{\cal S}\) \(\newcommand{\wcal}{\cal W}\) \(\newcommand{\ecal}{\cal E}\) \(\newcommand{\coords}[2]{\left\{#1\right\}_{#2}}\) \(\newcommand{\gray}[1]{\color{gray}{#1}}\) \(\newcommand{\lgray}[1]{\color{lightgray}{#1}}\) \(\newcommand{\rank}{\operatorname{rank}}\) \(\newcommand{\row}{\text{Row}}\) \(\newcommand{\col}{\text{Col}}\) \(\renewcommand{\row}{\text{Row}}\) \(\newcommand{\nul}{\text{Nul}}\) \(\newcommand{\var}{\text{Var}}\) \(\newcommand{\corr}{\text{corr}}\) \(\newcommand{\len}[1]{\left|#1\right|}\) \(\newcommand{\bbar}{\overline{\bvec}}\) \(\newcommand{\bhat}{\widehat{\bvec}}\) \(\newcommand{\bperp}{\bvec^\perp}\) \(\newcommand{\xhat}{\widehat{\xvec}}\) \(\newcommand{\vhat}{\widehat{\vvec}}\) \(\newcommand{\uhat}{\widehat{\uvec}}\) \(\newcommand{\what}{\widehat{\wvec}}\) \(\newcommand{\Sighat}{\widehat{\Sigma}}\) \(\newcommand{\lt}{<}\) \(\newcommand{\gt}{>}\) \(\newcommand{\amp}{&}\) \(\definecolor{fillinmathshade}{gray}{0.9}\)Chapter 4 Homework
For all parts of this problem, \(H_0: p = 0.70\), \(H_1: p < 0.70\). Show all supporting work including formulas, substitutions, and solutions as appropriate.
- What is the probability the first unit selected is a success?
- What is the probability the first unit selected is a failure?
- What is the probability the first five units selected will be in the order of FSSSF?
- If 5 values are selected, how many combinations are there for 3 successes?
- What is the probability three of five units will be a success?
- Create the entire binomial probability distribution if 5 units are selected. Record probabilities to 4 decimal places and then draw a stick graph in the provided space.
0.40 0.35 0.30 0.25 0.20 0.15 0.10 0.05 0 |
||||||
| \(X = x\) | 0 | 1 | 2 | 3 | 4 | 5 |
| \(P(X = x)\) |
- What is the mean and standard deviation of this binomial distribution?
- Test the hypotheses if there were 3 successes in a sample of 5, what is the probability that three or fewer successes would be obtained if the null hypothesis is true? This is a p-value. At the 0.20 level of significance, which hypothesis is supported?
For all parts of this problem, \(H_0: p = 0.40\), \(H_1: p > 0.40\). Show all supporting work including formulas, substitutions, and solutions as appropriate.
a. What is the probability the first unit selected is a success?
b. What is the probability the first unit selected is a failure?
c. What is the probability the first five units selected will be in the order of SFSFSSS?
d. If 7 values are selected, how many combinations are there for 5 successes?
e. What is the probability three of five units will be a success?
f. Create the entire binomial probability distribution if 5 units are selected. Record probabilities to 4 decimal places and then draw a stick graph in the provided space.
0.40 0.35 0.30 0.25 0.20 0.15 0.10 0.05 0 |
||||||
| \(X = x\) | 0 | 1 | 2 | 3 | 4 | 5 |
| \(P(X = x)\) |
- What is the mean and standard deviation of this binomial distribution?
- Test the hypotheses if there were 5 successes in a sample of 7, what is the probability that three or fewer successes would be obtained if the null hypothesis is true? This is a p-value. At the 0.20 level of significance, which hypothesis is supported?
Briefing 5.1 Coal Export Terminals in the Pacific Northwest
Coal is used to produce electricity. It is also a major contributor of greenhouse gases and other pollutants to the atmosphere. A substantial amount of coal is mined in Montana and Wyoming. One goal is to export this coal to Asia. To do so means building coal terminals in Washington or Oregon. Some people want that to happen because it will bring money to the coal producers and jobs to those who work for the railroad or coal terminals. Others are opposed because of the impact to the community because of frequent long trains that will go through the towns, the pollution from the coal dust that is lost by the trains, the impact on the fishing industry from water pollution and the effect coal has on the climate.
- Assume that in a hypothetical Pacific Northwest coast community that has been suggested as a potential coal terminal location, the mayor of the town has mixed thoughts about whether to support the project or oppose it. While it will bring more jobs to the community that needs them, the consequences are troubling. The mayor decides to have a survey conducted. 300 people will be surveyed. If a majority of the residents in the community oppose the coal terminal (success), the mayor will also oppose it; otherwise the mayor will support it. The hypotheses used to test for a majority are \(H_0: p = 0.50\) and \(H_1: p > 0.50\). The level of significance is 0.05.
a. What is the probability that the \(30^{\text{th}}\) person selected by the pollster opposes the coal terminal?
b. What is the probability that the \(287^{\text{th}}\) person selected by the pollster doesn’t oppose the coal terminal?
c. What is the probability that the first ten people selected will be in this order, where S represents opposition to the terminal and F represents not being opposed: SFFFFFSFSS?
DATA: 165 out of 300 surveyed people oppose the terminal.
d. What is the probability that the pollster obtained any specific sequence of 165 successes and 135 failures?
e. How many combinations are there for 165 successes in a sample of 300? 3f. What is the probability of 165 success in a sample of 300?
g. What is the mean of the binomial distribution if n is 300?h. What is the standard deviation of the binomial distribution if n is 300?
i. In a sample of 300, there could be between 0 and 300 successes. In this problem, you will only focus on 145 to 155 successes. Complete the partial distribution below and make a stick graph of this section of the distribution.
0.046
0.045
0.044
0.043
0.042
0.041
0.040
0.039\(X = x\) 145 146 147 148 149 150 151 152 153 154 155 \(P(X = x)\) j. Use the binomial distribution to determine which hypothesis is supported if 165 out of 300 people opposed the terminal? Show the calculator function that will be used, and your substitutions. Write a complete concluding sentence in the style of a scholarly journal that includes the p-value and sample size.
Calculator Input p-value
k. Use the normal approximation to the binomial distribution. Draw and label the normal curve. Find the z-score, and p-value then write a complete concluding sentence in the style of a scholarly journal that includes the z-score, p-value and sample size. Show the formula and substitution for the z score.
Formula Substitution z value p-value
l. What is the sample proportion of people opposed to the terminal?m. What is the mean and standard deviation of the distribution of \(\hat{p}\)? Show formulas, substitutions and solutions.
3n. Use the sampling distribution of sample proportion method for testing the hypothesis. Draw and label a normal curve. Find the z-score, and p-value then write a complete concluding sentence in the style of a scholarly journal that includes the z-score, p-value and sample size. Show the formula and substitution for the z score.
Formula Substitution z value p-value
o. Based on the results of all of these hypothesis tests, will the mayor support or oppose the project? - In 2001, the Seattle Mariners won 116 games, which tied a record for the most number of games won by a baseball team in a season. During that year, the average attendance at home games in Safeco Field was 43,362. (http://www.baseball-almanac.com/teams/mariatte.shtml, viewed 9/13/13). Assume the standard deviation is 7,900 and that attendance is normally distributed. A sample of attendance at 10 games is taken from the 2013 season. Let α = 0.10.
10493 13000 30089 16294 13823 24701 18000 28198 15995 11656 Test the hypothesis that the average attendance in 2013 is less than it was in 2001.
a. What hypotheses would be used to test if the average attendance in 2013 is less than 43,362.b. What is the mean of the distribution of sample means that is appropriate for testing this hypothesis?
c. What is the standard deviation of the distribution of sample means that is appropriate for testing this hypothesis?
d. Draw and label a normal curve for the sampling distribution.
e. What is the sample mean from 2013?
f. Test the hypothesis. Show all appropriate formulas, substitutions and solutions and write your complete concluding sentence.
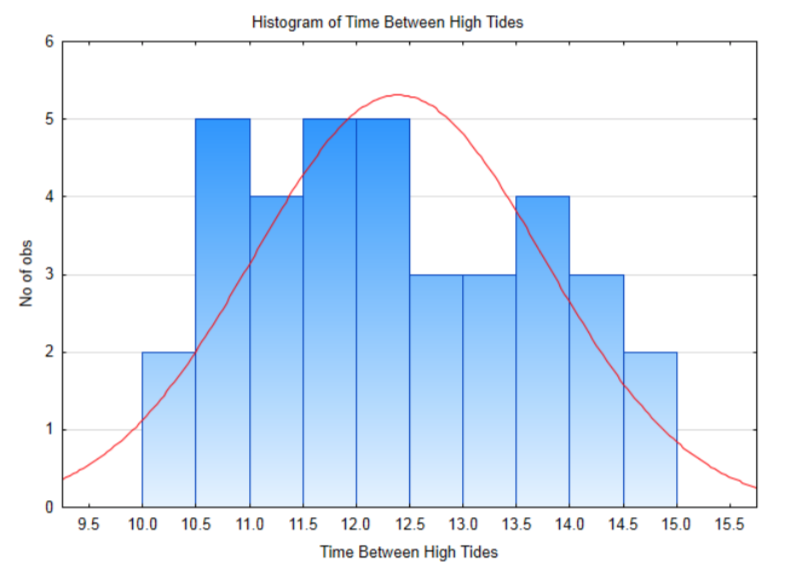
Formula Substitution z value p-value - Ocean fishermen and boaters are familiar with tides and usually consult a tide table when planning a trip, but infrequent visitors to marine waters are less familiar with tides. As a first step in learning about tides, a curious person wants to determine if the time between consecutive high tides is greater than 12 hours? The hypotheses are \(H_0: \mu = 12\) and \(H_1: \mu > 12\). Assume the standard deviation is 1.4 hours. Let \(\alpha = 0.05\).
A histogram of 36 times between consecutive high tides from September 2013 is shown below.(tides.mobilegeographics.com/c...onth/2152.html viewed 9/13/13 for Gig Harbor.)
a. Assuming the null hypothesis is true, then what is the mean of the sampling distribution of sample means for 36 differences between consecutive high tides?
b. Assuming the null hypothesis is true, then what is the standard deviation of the sampling distribution of sample means for 36 differences between consecutive high tides?
c. Draw and label a normal curve for the distribution of \(\bar{x}\), if n=36.
d. Test the hypothesis if the sample mean time between consecutive high tides is 12.38 hours. Show the formula, substitution and solution. Write a complete concluding sentence that includes the z score, p-value and sample size.
Formula Substitution z value p-value - According to the website walkscore.com, a walk score is a number between 0 and 100 that measures the walkability of any address. Scores over 90 indicate a Walker’s Paradise while scores under 50 are car-dependent. Advantages of walkable neighborhoods include lower weight for residents, fewer carbon emissions and less car expenses. The objective of this experiment is to determine if smaller communities, defined for this problem as having less than 100,000 residents, have a higher average walk score than the largest cities. For the purposes of this problem, the average walk score of the largest 31 cities is 54.1. Assume the standard deviation for walk scores is 16.1. Let \(\alpha = 0.05\).
a. Complete the design-layout table.
Research Design Table Research Question Type of Research Observational Study
Observational Experiment
Manipulative ExperimentWhat is the response variable? What is the parameter that will be calculated? Mean Porportion Correlation List potential latent variables Grouping/explanatory Variables 1 (if present) Levels: Grouping/explanatory Variables 2 (if present) Levels: b. What are the hypotheses for this problem?
The walk scores of the 30 cities in the sample are provided below.33 59 37 33 31 29 36 47 42 43 69 38 22 57 36 48 51 34 66 92 65 65 40 25 58 29 45 63 40 69 c. Make a frequency distribution and histogram for this data. Use reader-friendly class boundaries.
d. Find the sample mean and standard deviation
e. What is the mean and standard deviation of the sampling distribution of sample means that is based on the null hypothesis?
f. Draw and label the normal distribution for the sample means.
g. Test the hypothesis. Show formulas, substitutions and solutions. Write a complete conclusion including z score, p-value and sample size.
Formula Substitution z value p-value
h. Can we conclude smaller towns have a higher walk score than the largest cities? - Magazines about sports regularly contain predictions about who will win games or championships. One would expect that the writers who make the predictions would have considerable expertise and insight and have a high rate of success. At a minimum, one would hope that the writers are better than a coin flip for determining winners. A coin flip has a 50% chance of picking the winning team.
To test if the writers are better than a coin flip, two major sports magazines were selected and predictions from regular NFL games were compared with results. A success was if the prediction was correct, and a failure was if the prediction was wrong. Use a 5% level of significance.
b. Write the hypotheses.
The reporters picked the winning team 181 out of 322 times.
c. What is the sample proportion?d. Make a completely labeled pie chart.
e. Test the hypothesis using the binomial distribution. Write a complete concluding sentence.
Calculator Input p-value
f. What is the mean and standard deviation of the binomial distribution for this problem?
g. Test the hypothesis using the normal approximation to the binomial distribution. Include a completely labeled drawing of the normal curve, the appropriate formulas, substitutions and solutions and then write a complete concluding sentence.
Formula Substitution z value p-valueh. Test the hypothesis using the sampling distribution method. Include a completely labeled drawing of the normal curve, the appropriate formulas, substitutions and solutions and then write a complete concluding sentence.
What is the sample proportion?
Formula Substitution z value p-value
i. Based on the statistical results, do these sports writers appear to be better than a coin flip? Are you impressed by their ability to predict NFL winners? - Developed in collaboration with Alan Kemp, Professor of Sociology and author of the bookDeath, Dying and Bereavement in a Changing World, published by Pearson, 2013.
This topic is discussed in SOC 212, Sociology of Death.
Briefing 5.2
Terror Management Theory (TMT) was developed by Ernest Becker in the 1960s and 1970s. Extensive experimentation has been done to test these theories. This problem is based on the article Evidence for terror management theory: 1. The effects of mortality salience on reactions to those who violate or uphold cultural values. By Rosenblatt, Greenberg, Solomon, Pyszczynski and Lyon. It was published in the Journal of Personality and Social Psychology, Vol 57(4), Oct, 1989 pp 681-690.
A basic premise behind the theory is that humans are the only species who recognize their own mortality (they know they will die in the future). Consequently, humans need a way to manage the emotions related to this knowledge. The two predominate ways that humans cope are with culture (e.g. religion and other beliefs) and self-efficacy which means that we want to know that what we do matters within our cultural worldview. One such consequence of this is that following a terrorist attack or deadly natural disaster, patriotism increases (culture) as does heroism (self-efficacy).
Cultures are an artificial construction and therefore the worldview they portray can be exposed to potential threats. Since a culture can provide the standards by which a person can feel that life is fair, any person or idea that threatens the cultural norms must be removed or punished. Consequently, an expected outcome of this theory is that people will respond positively toward those who support cultural values and negatively toward those who violate these values. To test the theory, the authors of the article designed an experiment to determine if a reminder of one’s own mortality would lead to more negative responses for something that violates cultural values.
Municipal court judges were selected for this experiment. The purpose of the experiment was disguised. The judges were given a questionnaire. Within the questionnaire of half the judges were questions about their thoughts and feelings about the prospect of their own death. The remaining judges did not have these questions. Judges were randomly assigned the questionnaire. Following questions, the judges were given a scenario about a case of alleged prostitution and asked to set the amount of bail for the prostitute. Prostitution was used because it emphasized the moral nature of the alleged crime. No effort was made to determine the judge’s opinion about prostitution, which could affect their bail amount. Judges were selected for this experiment because they have been trained to make such punishments. The objective was to determine if the reminder about their own mortality would lead to harsher penalties when someone violated the cultural norms. The average bail amount between the two groups will be compared.
The hypotheses that will be tested are meant to show that judges who have been reminded about their own mortality (impact) will set higher bail amounts than judges who have not been reminded (control). \(H_0: \mu_{\text{impact}} = \mu_{\text{control}}\), \(H_1: \mu_{\text{impact}} > \mu_{\text{control}}\), \(\alpha = 0.05\)
The following data is not authentic, but it closely approximates the results obtained by the researchers. The impact group of judges was reminded of their own mortality. The control group was not.
Amount of Bail impact 50 50 150 200 1500 1500 1200 205 50 50 50 Control 25 25 25 50 150 50 50 25 25 25 25 a. Make an appropriate graph so that the two groups can be compared. You need to decide what is appropriate.
b. Complete the table below.Impact Control Mean Standard Deviation Median c. The p-value for the comparison of the mean bail amount is 0.041. The sample size is 22. Write a complete concluding sentence to show if there is a significant difference between the bail amounts set by judges reminded of their own mortality and judges who were not reminded.
d. Do the results of this experiment support the contention that contemplation of one’s own death leads to increased punishment of those who violate cultural norms?