
15.2.6: Chapter 7 Homework
- Page ID
- 28309

\( \newcommand{\vecs}[1]{\overset { \scriptstyle \rightharpoonup} {\mathbf{#1}} } \) \( \newcommand{\vecd}[1]{\overset{-\!-\!\rightharpoonup}{\vphantom{a}\smash {#1}}} \)\(\newcommand{\id}{\mathrm{id}}\) \( \newcommand{\Span}{\mathrm{span}}\) \( \newcommand{\kernel}{\mathrm{null}\,}\) \( \newcommand{\range}{\mathrm{range}\,}\) \( \newcommand{\RealPart}{\mathrm{Re}}\) \( \newcommand{\ImaginaryPart}{\mathrm{Im}}\) \( \newcommand{\Argument}{\mathrm{Arg}}\) \( \newcommand{\norm}[1]{\| #1 \|}\) \( \newcommand{\inner}[2]{\langle #1, #2 \rangle}\) \( \newcommand{\Span}{\mathrm{span}}\) \(\newcommand{\id}{\mathrm{id}}\) \( \newcommand{\Span}{\mathrm{span}}\) \( \newcommand{\kernel}{\mathrm{null}\,}\) \( \newcommand{\range}{\mathrm{range}\,}\) \( \newcommand{\RealPart}{\mathrm{Re}}\) \( \newcommand{\ImaginaryPart}{\mathrm{Im}}\) \( \newcommand{\Argument}{\mathrm{Arg}}\) \( \newcommand{\norm}[1]{\| #1 \|}\) \( \newcommand{\inner}[2]{\langle #1, #2 \rangle}\) \( \newcommand{\Span}{\mathrm{span}}\)\(\newcommand{\AA}{\unicode[.8,0]{x212B}}\)
- The completion time (in minutes) for a student to complete a short quiz follows the probability density function shown here, with some areas calculated.
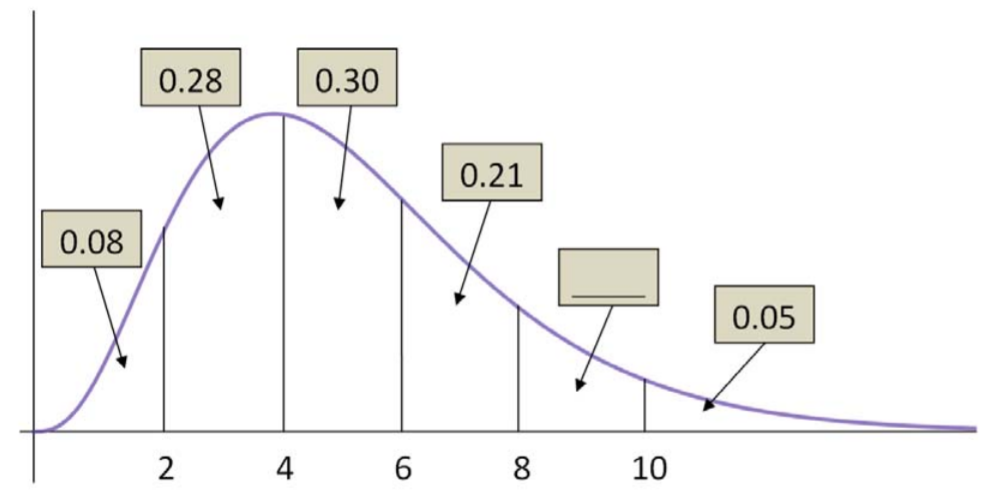
- Find the probability that a student completes the exam in 4 minutes or less.
- Find the probability that a student needs between 8 and 10 minutes to finish the quiz.
- If the instructor allows 10 minutes for the quiz and the class has 40 students, how many students will run out of time before the quiz is finished?
- Find the 64th percentile of the distribution.
- A ferry boat leaves the dock once per hour. Your waiting time for the next ferry boat will follow a uniform distribution from 0 to 60 minutes.
- Find the mean and variance of this random variable.
- Find the probability of waiting more than 20 minutes for the next ferry.
- Find the probability of waiting exactly 20 minutes for the next ferry.
- Find the probability of waiting between 15 and 35 minutes for the next ferry.
- Find the conditional probability of waiting at least 10 more minutes after you have already waited 15 minutes.
- Find the probability of waiting more than 45 minutes for the ferry on 3 consecutive independent days.
- The cycle times for a truck hauling concrete to a highway construction site are uniformly distributed over the interval 50 to 70 minutes.
- Find the mean and variance for cycle times.
- Find the 5th and 95th percentile of cycle times.
- Find the interquartile range.
- Find the probability that the cycle time for a randomly selected truck exceeds 62 minutes.
- If you are given that the cycle time exceeds 55 minutes, find the probability that the cycle time is between 60 and 65 minutes.
- The amount of gas in a car’s tank (X) follows a Uniform Distribution, in which the minimum is zero and the maximum is 12 gallons.
- Find the mean and median amount of gas in the tank.
- Find the variance and standard deviation of gas in the tank.
- Find the probability that there is more than 3 gallons in the tank.
- Find the probability that there is between 4 and 6 gallons in the tank.
- Find the probability that there is exactly 3 gallons in the tank.
- Find the 80th percentile of gas in the tank.
- A normally distributed population of package weights has a mean of 63.5 g and a standard deviation of 12.2 g.
- What percentage of this population weighs 66 g or more?
- What percentage of this population weighs 41 g or less?
- What percentage of this population weighs between 41 g and 66 g?
- Find the 60th percentile for distribution of weights.
- Find the three quartiles and the interquartile range.
- Assume the expected waiting time until the next RM (Richter Magnitude) 7.0 or greater earthquake somewhere in California follows an exponential distribution with \(\mu=10\) years.
- Find the probability of waiting 10 or more years for the next RM 7.0 or greater earthquake.
- Determine the median waiting time until the next RM 7.0 or greater earthquake.
- High Fructose Corn Syrup (HFCS) is a sweetener in food products that is linked to obesity and Type 2 Diabetes. The mean annual consumption in the United States in 2008 of HFCS was 60 lbs with a standard deviation of 20 lbs. Assume the population follows a Normal Distribution.
- Find the probability that a randomly selected American consumes more than 50 lbs of HFCS per year.
- Find the probability that a randomly selected American consumes between 30 and 90 lbs of HFCS per year.
- Find the 80th percentile of annual consumption of HFCS.
- Between what two numbers would you expect to contain 95% of Americans HFCS annual consumption?
- Find the quartiles and Interquartile range for this population.
- A teenager who loves soda consumes 105 lbs of HFCS per year. Is this result unusual? Use probability to justify your answer.
- A nuclear power plant experiences serious accidents once every 8 years. Let X = the waiting time until the next serious accident.
- What is the mean and standard deviation of the random variable X?
- Determine the probability of waiting more than 10 years before the next serious accident.
- Suppose a plant went 5 years without a serious accident. Find the probability of waiting more than 10 years before the next serious accident.
- Determine the probability of waiting less than 5 years before the next serious accident.
- What is median waiting time until the next serious accident?
- Find the Interquartile range for this distribution.