
8.2: Split-Plot Design in CRD
- Page ID
- 33902

Recall the irrigation amount and fertilizer type example we discussed in the previous section. We had two large lands and managing the irrigation amount was harder on a smaller scale; we assigned the irrigation amount within each land to whole plots using an RCBD.
Now suppose in this case, instead of two large lands, we had 4 large fields. Irrigation amount is still a factor that is difficult to control. In that case, we can assign the irrigation amount randomly using a CRD for the 4 whole plots. Then each whole plot can be divided into smaller fields (subplots) and we can assign fertilizer type randomly within each whole plot.
Within the whole plot, the subplots are always arranged in an RCBD. The difference between split-plot in RCBD and split-plot in CRD is how the whole plot factor is randomized.
Example:
Consider a study in which the experimenters are interested in two factors: irrigation (Factor A at 2 levels) and seed type (Factor B at 2 levels), and they are crossed to form a factorial treatment design. The seed treatment can be easily applied at a small scale, but the irrigation treatment is problematic. Irrigating one plot may influence neighboring plots, and furthermore, the irrigation equipment is most efficiently used in a large area. As a result, the investigators want to apply the irrigation to a large whole plot and then split the whole plot into 2 smaller subplots in which they can apply the seed treatment levels.
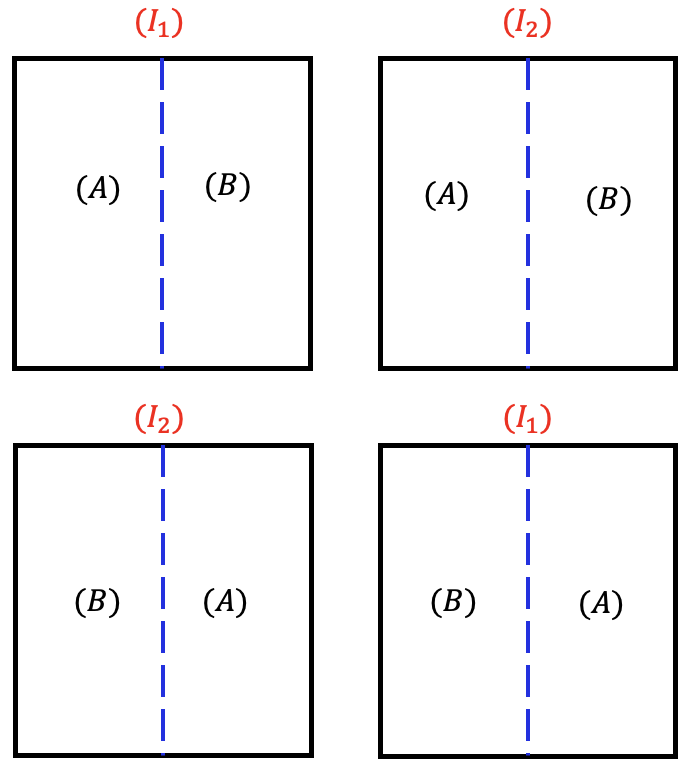
In the first step, the levels of the irrigation treatment are applied to four experimental (fields) to end up with 2 replications:
| Field 1 | Field 2 | Field 3 | Field 4 |
|---|---|---|---|
| A2 | A1 | A1 | A2 |
Following that, the fields are split into two subplots and a level of Factor B is randomly applied to subplots within each application of the Irrigation treatment:
| Field 1 | Field 2 | Field 3 | Field 4 |
|---|---|---|---|
| A2 B2 | A1 B1 | A1 B2 | A2 B1 |
| A2 B1 | A1 B2 | A1 B1 | A2 B2 |
In this design, the whole plot treatments (i.e factor A, irrigation) are arranged in a CRD and the subplot treatments (i.e. factor B, seed type) are arranged within whole plots in an RCBD.
If we carefully think about this, we see that the replicates (i.e. fields) are nested within the whole factor levels. For example, fields 2 and 3 are nested within level \(A_{1}\), and fields 1 and 4 are nested within level \(A_{2}\). So the variability due to replicates is nested within the whole factor.
The statistical model for the design is: \[Y_{ijk} = \mu + \alpha_{i} + \gamma_{k(i)} + \beta_{j} + (\alpha \beta)_{ij} + \epsilon_{ijk}\]
where \(i=1,2,\ldots,a\), \(j=1,2,\ldots,b\), and \(k=1,2,\ldots,r\) where \(a\) is the number of levels in factor A, \(b\) is the number of levels in factor B and \(r\) is the number of replicates.
As discussed in section 8.1, from the perspective of whole plots (i.e. Factor A, irrigation), the subplots are simply subsamples and it is reasonable to average them when testing the whole plot effects. If the values of the subplots within each whole plot are average, the resulting design is CRD, and the error term in a simple CRD is the \(\text{replication(whole factor)}\). Therefore, for split-plot in CRD, the whole plot errors are computationally equivalent to \(\text{replication(whole factor)}\), but in order to use it, we must explicitly extract it from the error term and put it in the model.
The ANOVA table, in this case, would look like this:
| Source | DF | Expected Mean Square | Error Term |
|---|---|---|---|
| (Whole Plots) | |||
| A | 1 | Var(Residual) + 2Var(Replicate(A)) + Q(A, A*B) | MS(Replicate(A)) |
| Replicate(A) | 2 | Var(Residual) + 2Var(Replicate(A)) | |
| (Subplots) | |||
| B | 1 | Var(Residual) + Q(B, A*B) | MS(Residual) |
| A*B | 1 | Var(Residual) + Q(A*B) | MS(Residual) |
| Residual | 2 | Var(Residual) |
Using Technology
SAS Example
In SAS, the code would be:
proc mixed data=example_8_2 method=type3;
class factorA factorB field;
model resp=factorA factorB factorA*factorB;
random field(factorA);
run;