
6.1: The Central Limit Theorem for Sample Means
- Page ID
- 29606
\( \newcommand{\vecs}[1]{\overset { \scriptstyle \rightharpoonup} {\mathbf{#1}} } \)
\( \newcommand{\vecd}[1]{\overset{-\!-\!\rightharpoonup}{\vphantom{a}\smash {#1}}} \)
\( \newcommand{\id}{\mathrm{id}}\) \( \newcommand{\Span}{\mathrm{span}}\)
( \newcommand{\kernel}{\mathrm{null}\,}\) \( \newcommand{\range}{\mathrm{range}\,}\)
\( \newcommand{\RealPart}{\mathrm{Re}}\) \( \newcommand{\ImaginaryPart}{\mathrm{Im}}\)
\( \newcommand{\Argument}{\mathrm{Arg}}\) \( \newcommand{\norm}[1]{\| #1 \|}\)
\( \newcommand{\inner}[2]{\langle #1, #2 \rangle}\)
\( \newcommand{\Span}{\mathrm{span}}\)
\( \newcommand{\id}{\mathrm{id}}\)
\( \newcommand{\Span}{\mathrm{span}}\)
\( \newcommand{\kernel}{\mathrm{null}\,}\)
\( \newcommand{\range}{\mathrm{range}\,}\)
\( \newcommand{\RealPart}{\mathrm{Re}}\)
\( \newcommand{\ImaginaryPart}{\mathrm{Im}}\)
\( \newcommand{\Argument}{\mathrm{Arg}}\)
\( \newcommand{\norm}[1]{\| #1 \|}\)
\( \newcommand{\inner}[2]{\langle #1, #2 \rangle}\)
\( \newcommand{\Span}{\mathrm{span}}\) \( \newcommand{\AA}{\unicode[.8,0]{x212B}}\)
\( \newcommand{\vectorA}[1]{\vec{#1}} % arrow\)
\( \newcommand{\vectorAt}[1]{\vec{\text{#1}}} % arrow\)
\( \newcommand{\vectorB}[1]{\overset { \scriptstyle \rightharpoonup} {\mathbf{#1}} } \)
\( \newcommand{\vectorC}[1]{\textbf{#1}} \)
\( \newcommand{\vectorD}[1]{\overrightarrow{#1}} \)
\( \newcommand{\vectorDt}[1]{\overrightarrow{\text{#1}}} \)
\( \newcommand{\vectE}[1]{\overset{-\!-\!\rightharpoonup}{\vphantom{a}\smash{\mathbf {#1}}}} \)
\( \newcommand{\vecs}[1]{\overset { \scriptstyle \rightharpoonup} {\mathbf{#1}} } \)
\( \newcommand{\vecd}[1]{\overset{-\!-\!\rightharpoonup}{\vphantom{a}\smash {#1}}} \)
25
The Central Limit Theorem for Sample Means
jkesler
Suppose X is a random variable with a distribution that may be known or unknown (it can be any distribution). Using a subscript that matches the random variable, suppose:
- μX = the mean of X
- σX = the standard deviation of X
If you draw random samples of size n, then as n increases, the random variable $\bar X$ which consists of sample means, tends to be normally distributed and
$\bar X \sim N\left( \mu_x, \frac{\sigma_x}{\sqrt{n}} \right) $
The central limit theorem for sample means says that if you repeatedly draw samples of a given size (such as repeatedly rolling ten dice) and calculate their means, those means tend to follow a normal distribution (the sampling distribution). As sample sizes increase, the distribution of means more closely follows the normal distribution. The normal distribution has the same mean as the original distribution and a variance that equals the original variance divided by the sample size. Standard deviation is the square root of variance, so the standard deviation of the sampling distribution is the standard deviation of the original distribution divided by the square root of n. The variable n is the number of values that are averaged together, not the number of times the experiment is done.
To put it more formally, if you draw random samples of size n, the distribution of the random variable $\bar X$, which consists of sample means, is called the sampling distribution of the mean. The sampling distribution of the mean approaches a normal distribution as n, the sample size, increases.
The random variable $\bar X$ has a different z-score associated with it from that of the random variable $X$. The mean $\bar x$ is the value of $\bar X$ in one sample.
$$z=\frac{\bar x -\mu_x}{\sigma_x/\sqrt{n}}$$
When there is not too much confusion that would be introduced, the subscripts can be omitted for ease of reading:
$$z=\frac{\bar x -\mu}{\sigma/\sqrt{n}}$$
$\mu_x$ is the average of both $X$ and $\bar X$. “>X¯¯¯
$$\sigma_{\bar x}=\frac{\sigma_x}{\sqrt{n}}$$ is the standard deviation of $\bar X$ and is called the standard error of the mean.
Example 6.1
An unknown distribution has a mean of 90 and a standard deviation of 15. Samples of size n = 25 are drawn randomly from the population.
- Find the probability that the sample mean is between 85 and 92.
- Find the value that is two standard deviations above the expected value, 90, of the sample mean.
Try It 6.1
An unknown distribution has a mean of 45 and a standard deviation of eight. Samples of size n = 30 are drawn randomly from the population. Find the probability that the sample mean is between 42 and 50.
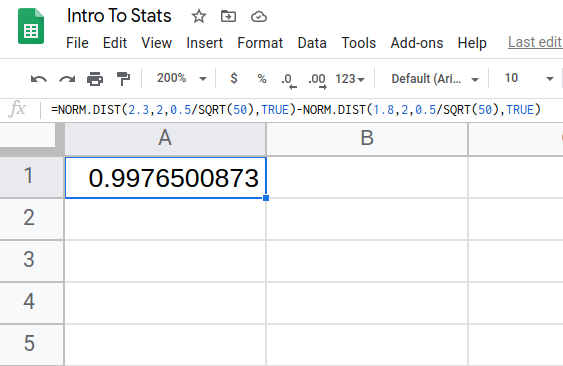
Example 6.2
The length of time, in hours, it takes an “over 40” group of people to play one soccer match is normally distributed with a mean of two hours and a standard deviation of 0.5 hours. A sample of size n = 50 is drawn randomly from the population. Find the probability that the sample mean is between 1.8 hours and 2.3 hours.

Try It 6.2
The length of time taken on the SAT for a group of students is normally distributed with a mean of 2.5 hours and a standard deviation of 0.25 hours. A sample size of n = 60 is drawn randomly from the population. Find the probability that the sample mean is between two hours and three hours.
Using Google Sheets
To find percentiles for means on a spreadsheet, we can use the NORM.INV funcation. Follow these steps:
In a cell, type
=NORM.INV(x, mean, standard_deviation)
where x is the xth percentile that you’re looking for and standard_deviation is $\sigma_x = \frac{\sigma}{\sqrt{n}}$
Example 6.3
In a recent study reported Oct. 29, 2012 on the Flurry Blog, the mean age of tablet users is 34 years. Suppose the standard deviation is 15 years. Take a sample of size n = 100.
- What are the mean and standard deviation for the sample mean ages of tablet users?
- What does the distribution look like?
- Find the probability that the sample mean age is more than 30 years (the reported mean age of tablet users in this particular study).
- Find the 95th percentile for the sample mean age (to one decimal place).
Try It 6.3
In an article on Flurry Blog, a gaming marketing gap for men between the ages of 30 and 40 is identified. You are researching a startup game targeted at the 35-year-old demographic. Your idea is to develop a strategy game that can be played by men from their late 20s through their late 30s. Based on the article’s data, industry research shows that the average strategy player is 28 years old with a standard deviation of 4.8 years. You take a sample of 100 randomly selected gamers. If your target market is 29- to 35-year-olds, should you continue with your development strategy?
Example 6.4
The mean number of minutes for app engagement by a tablet user is 8.2 minutes. Suppose the standard deviation is one minute. Take a sample of 60.
- What are the mean and standard deviation for the sample mean number of app engagement by a tablet user?
- What is the standard error of the mean?
- Find the 90th percentile for the sample mean time for app engagement for a tablet user. Interpret this value in a complete sentence.
- Find the probability that the sample mean is between eight minutes and 8.5 minutes.
Solution 6.4
- $\mu_{\bar x}=\mu=8.2, ~~~~$ $\sigma_{\bar x} =\frac{\sigma}{\sqrt{n}}=\frac{1}{\sqrt{60}}=0.13$
- The standard error of the mean allows us to calculate the probability of sample means of a particular distance from the mean, in repeated samples of size 60.
- Let $k=$ the 90th percentile. Using Google Sheets,
$k$=NORMINV(0.9, 8.2, 1/SQRT(60))= 8.37 . This values indicates that 90 percent of the average app engagement time for table users is less than 8.37 minutes. - First, convert 8 and 8.5 into $z$-scores; then subtract the area to the left of each to find the probability between 8 and 8.5
$z_{8} = \frac{\bar x-\mu_{\bar x}}{\sigma_{\bar x}/\sqrt{n}}= \frac{8-8.2}{1/\sqrt{60}}= -1.55$
$z_{8.5} = \frac{\bar x-\mu_{\bar x}}{\sigma_{\bar x}/\sqrt{n}}= \frac{8.5-8.2}{1/\sqrt{60}}= 2.32$
Now, using Google Sheets:
$P(8<\bar x<8.5)$= NORM.S.DIST(2.32) - NORM.S.DIST(-1.55)= 0.9293
Try It 6.4
Cans of a cola beverage claim to contain 16 ounces. The amounts in a sample are measured and the statistics are n = 34, $\bar x =$ 16.01 ounces. If the cans are filled so that μ = 16.00 ounces (as labeled) and σ = 0.143 ounces, find the probability that a sample of 34 cans will have an average amount greater than 16.01 ounces. Do the results suggest that cans are filled with an amount greater than 16 ounces?