
3.6: Tree and Venn Diagrams
- Page ID
- 20668

\( \newcommand{\vecs}[1]{\overset { \scriptstyle \rightharpoonup} {\mathbf{#1}} } \)
\( \newcommand{\vecd}[1]{\overset{-\!-\!\rightharpoonup}{\vphantom{a}\smash {#1}}} \)
\( \newcommand{\id}{\mathrm{id}}\) \( \newcommand{\Span}{\mathrm{span}}\)
( \newcommand{\kernel}{\mathrm{null}\,}\) \( \newcommand{\range}{\mathrm{range}\,}\)
\( \newcommand{\RealPart}{\mathrm{Re}}\) \( \newcommand{\ImaginaryPart}{\mathrm{Im}}\)
\( \newcommand{\Argument}{\mathrm{Arg}}\) \( \newcommand{\norm}[1]{\| #1 \|}\)
\( \newcommand{\inner}[2]{\langle #1, #2 \rangle}\)
\( \newcommand{\Span}{\mathrm{span}}\)
\( \newcommand{\id}{\mathrm{id}}\)
\( \newcommand{\Span}{\mathrm{span}}\)
\( \newcommand{\kernel}{\mathrm{null}\,}\)
\( \newcommand{\range}{\mathrm{range}\,}\)
\( \newcommand{\RealPart}{\mathrm{Re}}\)
\( \newcommand{\ImaginaryPart}{\mathrm{Im}}\)
\( \newcommand{\Argument}{\mathrm{Arg}}\)
\( \newcommand{\norm}[1]{\| #1 \|}\)
\( \newcommand{\inner}[2]{\langle #1, #2 \rangle}\)
\( \newcommand{\Span}{\mathrm{span}}\) \( \newcommand{\AA}{\unicode[.8,0]{x212B}}\)
\( \newcommand{\vectorA}[1]{\vec{#1}} % arrow\)
\( \newcommand{\vectorAt}[1]{\vec{\text{#1}}} % arrow\)
\( \newcommand{\vectorB}[1]{\overset { \scriptstyle \rightharpoonup} {\mathbf{#1}} } \)
\( \newcommand{\vectorC}[1]{\textbf{#1}} \)
\( \newcommand{\vectorD}[1]{\overrightarrow{#1}} \)
\( \newcommand{\vectorDt}[1]{\overrightarrow{\text{#1}}} \)
\( \newcommand{\vectE}[1]{\overset{-\!-\!\rightharpoonup}{\vphantom{a}\smash{\mathbf {#1}}}} \)
\( \newcommand{\vecs}[1]{\overset { \scriptstyle \rightharpoonup} {\mathbf{#1}} } \)
\( \newcommand{\vecd}[1]{\overset{-\!-\!\rightharpoonup}{\vphantom{a}\smash {#1}}} \)
\(\newcommand{\avec}{\mathbf a}\) \(\newcommand{\bvec}{\mathbf b}\) \(\newcommand{\cvec}{\mathbf c}\) \(\newcommand{\dvec}{\mathbf d}\) \(\newcommand{\dtil}{\widetilde{\mathbf d}}\) \(\newcommand{\evec}{\mathbf e}\) \(\newcommand{\fvec}{\mathbf f}\) \(\newcommand{\nvec}{\mathbf n}\) \(\newcommand{\pvec}{\mathbf p}\) \(\newcommand{\qvec}{\mathbf q}\) \(\newcommand{\svec}{\mathbf s}\) \(\newcommand{\tvec}{\mathbf t}\) \(\newcommand{\uvec}{\mathbf u}\) \(\newcommand{\vvec}{\mathbf v}\) \(\newcommand{\wvec}{\mathbf w}\) \(\newcommand{\xvec}{\mathbf x}\) \(\newcommand{\yvec}{\mathbf y}\) \(\newcommand{\zvec}{\mathbf z}\) \(\newcommand{\rvec}{\mathbf r}\) \(\newcommand{\mvec}{\mathbf m}\) \(\newcommand{\zerovec}{\mathbf 0}\) \(\newcommand{\onevec}{\mathbf 1}\) \(\newcommand{\real}{\mathbb R}\) \(\newcommand{\twovec}[2]{\left[\begin{array}{r}#1 \\ #2 \end{array}\right]}\) \(\newcommand{\ctwovec}[2]{\left[\begin{array}{c}#1 \\ #2 \end{array}\right]}\) \(\newcommand{\threevec}[3]{\left[\begin{array}{r}#1 \\ #2 \\ #3 \end{array}\right]}\) \(\newcommand{\cthreevec}[3]{\left[\begin{array}{c}#1 \\ #2 \\ #3 \end{array}\right]}\) \(\newcommand{\fourvec}[4]{\left[\begin{array}{r}#1 \\ #2 \\ #3 \\ #4 \end{array}\right]}\) \(\newcommand{\cfourvec}[4]{\left[\begin{array}{c}#1 \\ #2 \\ #3 \\ #4 \end{array}\right]}\) \(\newcommand{\fivevec}[5]{\left[\begin{array}{r}#1 \\ #2 \\ #3 \\ #4 \\ #5 \\ \end{array}\right]}\) \(\newcommand{\cfivevec}[5]{\left[\begin{array}{c}#1 \\ #2 \\ #3 \\ #4 \\ #5 \\ \end{array}\right]}\) \(\newcommand{\mattwo}[4]{\left[\begin{array}{rr}#1 \amp #2 \\ #3 \amp #4 \\ \end{array}\right]}\) \(\newcommand{\laspan}[1]{\text{Span}\{#1\}}\) \(\newcommand{\bcal}{\cal B}\) \(\newcommand{\ccal}{\cal C}\) \(\newcommand{\scal}{\cal S}\) \(\newcommand{\wcal}{\cal W}\) \(\newcommand{\ecal}{\cal E}\) \(\newcommand{\coords}[2]{\left\{#1\right\}_{#2}}\) \(\newcommand{\gray}[1]{\color{gray}{#1}}\) \(\newcommand{\lgray}[1]{\color{lightgray}{#1}}\) \(\newcommand{\rank}{\operatorname{rank}}\) \(\newcommand{\row}{\text{Row}}\) \(\newcommand{\col}{\text{Col}}\) \(\renewcommand{\row}{\text{Row}}\) \(\newcommand{\nul}{\text{Nul}}\) \(\newcommand{\var}{\text{Var}}\) \(\newcommand{\corr}{\text{corr}}\) \(\newcommand{\len}[1]{\left|#1\right|}\) \(\newcommand{\bbar}{\overline{\bvec}}\) \(\newcommand{\bhat}{\widehat{\bvec}}\) \(\newcommand{\bperp}{\bvec^\perp}\) \(\newcommand{\xhat}{\widehat{\xvec}}\) \(\newcommand{\vhat}{\widehat{\vvec}}\) \(\newcommand{\uhat}{\widehat{\uvec}}\) \(\newcommand{\what}{\widehat{\wvec}}\) \(\newcommand{\Sighat}{\widehat{\Sigma}}\) \(\newcommand{\lt}{<}\) \(\newcommand{\gt}{>}\) \(\newcommand{\amp}{&}\) \(\definecolor{fillinmathshade}{gray}{0.9}\)Sometimes, when the probability problems are complex, it can be helpful to graph the situation. Tree diagrams and Venn diagrams are two tools that can be used to visualize and solve conditional probabilities.
Tree Diagrams
A tree diagram is a special type of graph used to determine the outcomes of an experiment. It consists of "branches" that are labeled with either frequencies or probabilities. Tree diagrams can make some probability problems easier to visualize and solve. The following example illustrates how to use a tree diagram.
In an urn, there are 11 balls. Three balls are red (\(\text{R}\)) and eight balls are blue (\(\text{B}\)). Draw two balls, one at a time, with replacement (remember that "with replacement" means that you put the first ball back in the urn before you select the second ball). The tree diagram using frequencies that show all the possible outcomes follows.
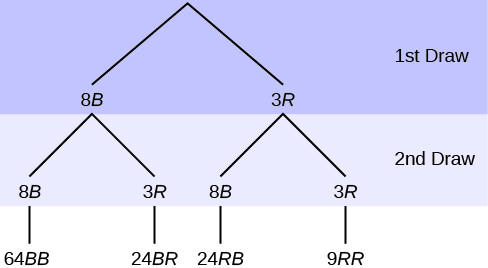
The first set of branches represents the first draw. The second set of branches represents the second draw. Each of the outcomes is distinct. In fact, we can list each red ball as R1, R2, and R3 and each blue ball as B1, B2, B3, B4, B5, B6, B7, and B8. Then the nine RR outcomes can be written as:
R1R1 R1R2 R1R3 R2R1 R2R2 R2R3 R3R1 R3R2 R3R3
The other outcomes are similar.
There are a total of 11 balls in the urn. Draw two balls, one at a time, with replacement. There are 11(11) = 121 outcomes, the size of the sample space.
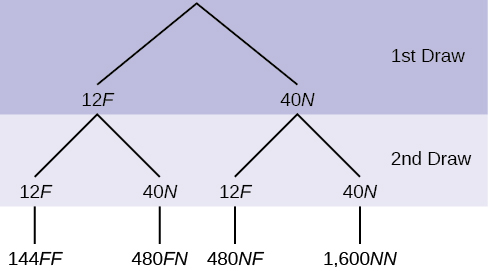
In a standard deck, there are 52 cards. 12 cards are face cards (event \(\text{F}\)) and 40 cards are not face cards (event \(\text{N}\)). Draw two cards, one at a time, with replacement. All possible outcomes are shown in the tree diagram as frequencies. Using the tree diagram, calculate \(P(\text{FF})\).
Answer
Total number of outcomes is 144 + 480 + 480 + 1600 = 2,704.
\[P(\text{FF}) = \frac{144}{144+480+480+1,600} = \frac{144}{2,704} = \frac{9}{169}\]
- a. List the 24 BR outcomes: B1R1, B1R2, B1R3, ...
- b. Using the tree diagram, calculate P(RR).
- c. Using the tree diagram, calculate \(P(\text{RB OR BR})\).
- d. Using the tree diagram, calculate \(P(\text{R on 1st draw AND B on 2nd draw})\).
- e. Using the tree diagram, calculate P(R on 2nd draw GIVEN B on 1st draw).
- Using the tree diagram, calculate \(P(\text{BB})\).
- g. Using the tree diagram, calculate \(P(\text{B on the 2nd draw given R on the first draw})\).
Solution
- B1R1; B1R2; B1R3; B2R1; B2R2; B2R3; B3R1; B3R2; B3R3; B4R1; B4R2; B4R3; B5R1; B5R2; B5R3; B6R1; B6R2; B6R3 B7R1; B7R2; B7R3; B8R1; B8R2; B8R3
- \(P(\text{RR}) = \left(\frac{3}{11}\right) \left(\frac{3}{11}\right) = \frac{9}{121}\)
- \(P(\text{RB OR BR}) = \left(\frac{3}{11}\right) \left(\frac{8}{11}\right) + \left(\frac{8}{11}\right) \left(\frac{3}{11}\right) = \frac{48}{121}\)
- \(P(\text{R on 1st draw AND B on 2nd draw}) = P(\text{RB}) = \left(\frac{3}{11}\right) \left(\frac{8}{11}\right) = \frac{24}{121}\)
- P(R on 2nd draw GIVEN B on 1st draw) = P(R on 2nd|B on 1st) = \(\frac{24}{88}\) = \(\frac{3}{11}\) This problem is a conditional one. The sample space has been reduced to those outcomes that already have a blue on the first draw. There are 24 + 64 = 88 possible outcomes (24 BR and 64 BB). Twenty-four of the 88 possible outcomes are BR. \(\frac{24}{88}\) = \(\frac{3}{11}\)
- \(P(\text{BB}) = \frac{64}{121}\)
- \(P(\text{B on 2nd draw|R on 1st draw}) = \frac{8}{11}\). There are 9 + 24 outcomes that have \(\text{R}\) on the first draw (9 RR and 24 RB). The sample space is then 9 + 24 = 33. 24 of the 33 outcomes have \(\text{B}\) on the second draw. The probability is then \(\frac{24}{33}\).
An urn has three red marbles and eight blue marbles in it. Draw two marbles, one at a time, this time without replacement, from the urn. (remember that "without replacement" means that you do not put the first ball back before you select the second marble). Following is a tree diagram for this situation. The branches are labeled with probabilities instead of frequencies. The numbers at the ends of the branches are calculated by multiplying the numbers on the two corresponding branches, for example, \(\left(\frac{3}{11}\right)\left(\frac{2}{10}\right) = \frac{6}{110}\).
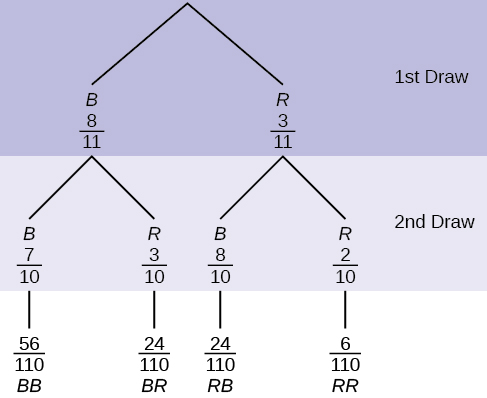
If you draw a red on the first draw from the three red possibilities, there are two red marbles left to draw on the second draw. You do not put back or replace the first marble after you have drawn it. You draw without replacement, so that on the second draw there are ten marbles left in the urn.
Calculate the following probabilities using the tree diagram.
- \(P(\text{RR}) =\) ________
- Fill in the blanks: \(P(\text{RB OR BR}) = \left(\frac{3}{11}\right) \left(\frac{8}{10}\right) +\) (___)(___) \(= \frac{48}{110}\)
- \(P(\text{R on 2nd|B on 1st}) =\)
- Fill in the blanks: \(P(\text{R on 1st AND B on 2nd}) = P(\text{RB}) =\) (___)(___) \(= \frac{24}{110}\)
- Find \(P(\text{BB})\).
- Find \(P(\text{B on 2nd|R on 1st})\).
Answers
- \(P(\text{RR}) = \left(\frac{3}{11}\right)\left(\frac{2}{10}\right) = \frac{6}{110}\)
- \(P(\text{RB OR BR}) = \left(\frac{3}{11}\right)\left(\frac{8}{10}\right) + \left(\frac{8}{11}\right)\left(\frac{3}{10}\right) = \frac{48}{110}\)
- \(P(\text{R on 2nd|B on 1st}) = \frac{3}{10}\)
- \(P(\text{R on 1st AND B on 2nd}) = P(\text{RB}) = \left(\frac{3}{11}\right) \left(\frac{8}{10}\right) = \frac{24}{110}\)
- \(P(\text{BB}) = \left(\frac{8}{11}\right)\left(\frac{7}{10}\right)\)
- Using the tree diagram, \(P(\text{B on 2nd|R on 1st}) = P(\text{R|B}) = \frac{8}{10}\).
If we are using probabilities, we can label the tree in the following general way.
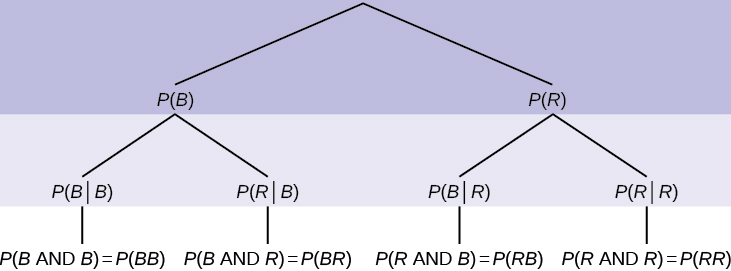
- \(P(\text{R|R})\) here means \(P(\text{R on 2nd|R on 1st})\)
- \(P(\text{B|R})\) here means \(P(\text{B on 2nd|R on 1st})\)
- \(P(\text{R|B})\) here means \(P(\text{R on 2nd|B on 1st})\)
- \(P(\text{B|B})\) here means \(P(\text{B on 2nd|B on 1st})\)
In a standard deck, there are 52 cards. Twelve cards are face cards (\(\text{F}\)) and 40 cards are not face cards (\(\text{N}\)). Draw two cards, one at a time, without replacement. The tree diagram is labeled with all possible probabilities.
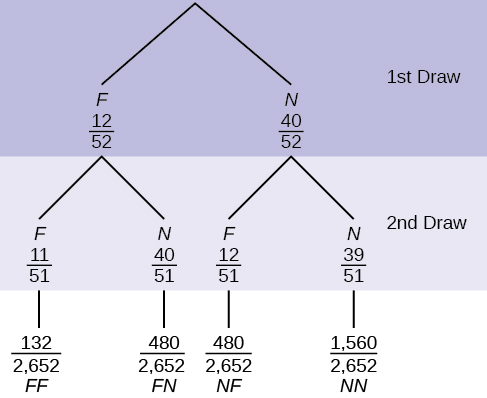
- Find \(P(\text{FN OR NF})\).
- Find \(P(\text{N|F})\).
- Find \(P(\text{at most one face card})\).
Hint: "At most one face card" means zero or one face card. - Find \(P(\text{at least on face card})\).
Hint: "At least one face card" means one or two face cards.
Answer
- \(P(\text{FN OR NF}) = \frac{480}{2,652} + \frac{480}{2,652} = \frac{960}{2,652} = \frac{80}{221}\)
- \(P(\text{N|F}) = \frac{40}{51}\)
- \(P(\text{at most one face card}) = \frac{(480+480+1,560)}{2,652} = \frac{2,520}{2,652}\)
- \(P(\text{at least one face card}) = \frac{(132+480+480)}{2,652} = \frac{1,092}{2,652}\)
A litter of kittens available for adoption at the Humane Society has four tabby kittens and five black kittens. A family comes in and randomly selects two kittens (without replacement) for adoption.
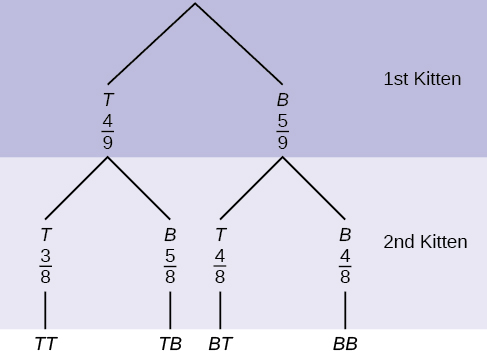
- What is the probability that both kittens are tabby?
a. \(\left(\frac{1}{2}\right) \left(\frac{1}{2}\right)\) b. \(\left(\frac{4}{9}\right) \left(\frac{4}{9}\right)\) c. \(\left(\frac{4}{9}\right) \left(\frac{3}{8}\right)\) d. \(\left(\frac{4}{9}\right) \left(\frac{5}{9}\right)\) - What is the probability that one kitten of each coloring is selected?
a. \(\left(\frac{4}{9}\right) \left(\frac{5}{9}\right)\) b. \(\left(\frac{4}{9}\right) \left(\frac{5}{8}\right)\) c. \(\left(\frac{4}{9}\right) \left(\frac{5}{9}\right)\) + \(\left(\frac{5}{9}\right) \left(\frac{4}{9}\right)\) d. \(\left(\frac{4}{9}\right) \left(\frac{5}{8}\right)\) + \(\left(\frac{5}{9}\right) \left(\frac{4}{8}\right)\) - What is the probability that a tabby is chosen as the second kitten when a black kitten was chosen as the first?
- What is the probability of choosing two kittens of the same color?
Answer
a. c, b. d, c. \(\frac{4}{8}\), d. \(\frac{32}{72}\)
Suppose there are four red balls and three yellow balls in a box. Three balls are drawn from the box without replacement. What is the probability that one ball of each coloring is selected?
Answer
\(\left(\frac{4}{7}\right) \left(\frac{3}{6}\right)\) + \(\left(\frac{3}{7}\right) \left(\frac{4}{6}\right)\)
Venn Diagram
A Venn diagram is a picture that represents the outcomes of an experiment. It generally consists of a box that represents the sample space S together with circles or ovals. The circles or ovals represent events.
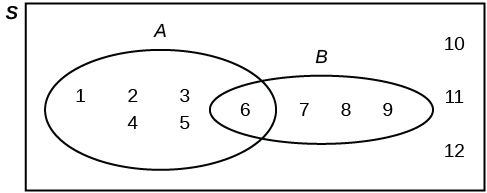
Suppose an experiment has the outcomes 1, 2, 3, ... , 12 where each outcome has an equal chance of occurring. Let event \(\text{A} =\) {1, 2, 3, 4, 5, 6} and event \(\text{B} =\) {6, 7, 8, 9}. Then \(\text{A AND B} =\) {6} and \(\text{A OR B} =\) {1, 2, 3, 4, 5, 6, 7, 8, 9}. The Venn diagram is as follows:
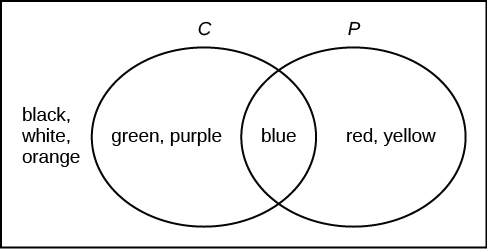
Suppose an experiment has outcomes black, white, red, orange, yellow, green, blue, and purple, where each outcome has an equal chance of occurring. Let event \(\text{C} =\) {green, blue, purple} and event \(\text{P} =\) {red, yellow, blue}. Then \(\text{C AND P} =\) {blue} and \(\text{C OR P} =\) {green, blue, purple, red, yellow}. Draw a Venn diagram representing this situation.
Answer
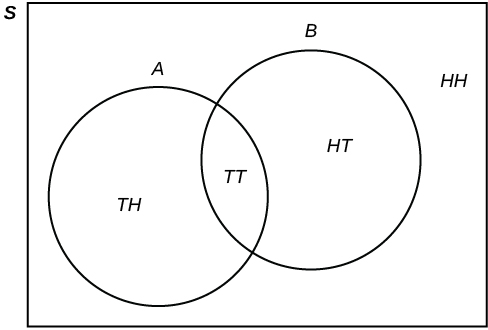
Flip two fair coins. Let \(\text{A} =\) tails on the first coin. Let \(\text{B} =\) tails on the second coin. Then \(\text{A} =\) {TT,TH} and \(\text{B} =\) {TT, HT}. Therefore, \(\text{A AND B} =\) {TT}. \(\text{A OR B} =\) {TH, TT, HT}.
The sample space when you flip two fair coins is \(X =\) {HH, HT, TH, TT}. The outcome HH is in \(\text{NEITHER A NOR B}\). The Venn diagram is as follows:
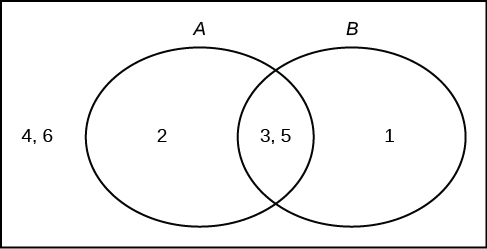
Roll a fair, six-sided die. Let \(\text{A} =\) a prime number of dots is rolled. Let \(\text{B} =\) an odd number of dots is rolled. Then \(\text{A} =\) {2, 3, 5} and \(\text{B} =\) {1, 3, 5}. Therefore, \(\text{A AND B} =\) {3, 5}. \(\text{A OR B} =\) {1, 2, 3, 5}. The sample space for rolling a fair die is \(\text{S} =\) {1, 2, 3, 4, 5, 6}. Draw a Venn diagram representing this situation.
Answer
Forty percent of the students at a local college belong to a club and 50% work part time. Five percent of the students work part time and belong to a club. Draw a Venn diagram showing the relationships. Let \(\text{C} =\) student belongs to a club and \(\text{PT} =\) student works part time.
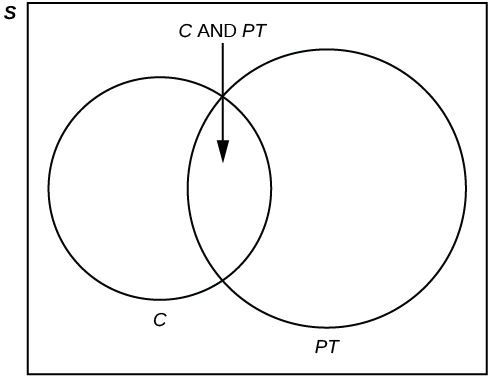
If a student is selected at random, find
- the probability that the student belongs to a club. \(P(\text{C}) = 0.40\)
- the probability that the student works part time. \(P(\text{PT}) = 0.50\)
- the probability that the student belongs to a club AND works part time. \(P(\text{C AND PT}) = 0.05\)
- the probability that the student belongs to a club given that the student works part time. \(P(\text{C|PT}) = \frac{P(\text{C AND PT})}{P(\text{PT})} = \frac{0.05}{0.50} = 0.1\)
- the probability that the student belongs to a club OR works part time. \(P(\text{C OR PT}) = P(\text{C}) + P(\text{PT}) - P(\text{C AND PT}) = 0.40 + 0.50 - 0.05 = 0.85\)
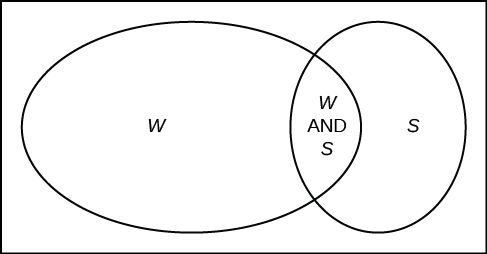
Fifty percent of the workers at a factory work a second job, 25% have a spouse who also works, 5% work a second job and have a spouse who also works. Draw a Venn diagram showing the relationships. Let \(\text{W} =\) works a second job and \(\text{S} =\) spouse also works.
Answer
A person with type O blood and a negative Rh factor (Rh-) can donate blood to any person with any blood type. Four percent of African Americans have type O blood and a negative RH factor, 5−10% of African Americans have the Rh- factor, and 51% have type O blood.
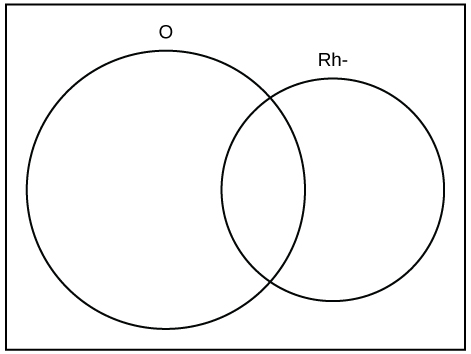
The “O” circle represents the African Americans with type O blood. The “Rh-“ oval represents the African Americans with the Rh- factor.
We will take the average of 5% and 10% and use 7.5% as the percent of African Americans who have the Rh- factor. Let \(\text{O} =\) African American with Type O blood and \(\text{R} =\) African American with Rh- factor.
- \(P(\text{O}) =\) ___________
- \(P(\text{R}) =\) ___________
- \(P(\text{O AND R}) =\) ___________
- \(P(\text{O OR R}) =\) ____________
- In the Venn Diagram, describe the overlapping area using a complete sentence.
- In the Venn Diagram, describe the area in the rectangle but outside both the circle and the oval using a complete sentence.
Answer
a. 0.51; b. 0.075; c. 0.04; d. 0.545; e. The area represents the African Americans that have type O blood and the Rh- factor. f. The area represents the African Americans that have neither type O blood nor the Rh- factor.
In a bookstore, the probability that the customer buys a novel is 0.6, and the probability that the customer buys a non-fiction book is 0.4. Suppose that the probability that the customer buys both is 0.2.
- Draw a Venn diagram representing the situation.
- Find the probability that the customer buys either a novel or anon-fiction book.
- In the Venn diagram, describe the overlapping area using a complete sentence.
- Suppose that some customers buy only compact disks. Draw an oval in your Venn diagram representing this event.
Answer
a. and d. In the following Venn diagram below, the blue oval represent customers buying a novel, the red oval represents customer buying non-fiction, and the yellow oval customer who buy compact disks.
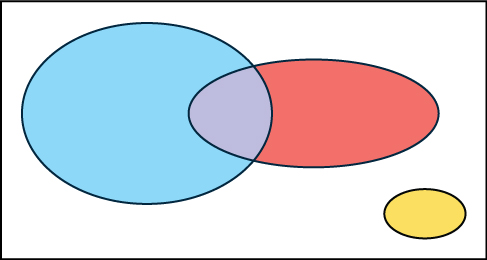
b. \(P(\text{novel or non-fiction}) = P(\text{Blue OR Red}) = P(\text{Blue}) + P(\text{Red}) - P(\text{Blue AND Red}) = 0.6 + 0.4 - 0.2 = 0.8\).
c. The overlapping area of the blue oval and red oval represents the customers buying both a novel and a nonfiction book.
References
- Data from Clara County Public H.D.
- Data from the American Cancer Society.
- Data from The Data and Story Library, 1996. Available online at http://lib.stat.cmu.edu/DASL/ (accessed May 2, 2013).
- Data from the Federal Highway Administration, part of the United States Department of Transportation.
- Data from the United States Census Bureau, part of the United States Department of Commerce.
- Data from USA Today.
- “Environment.” The World Bank, 2013. Available online at http://data.worldbank.org/topic/environment (accessed May 2, 2013).
- “Search for Datasets.” Roper Center: Public Opinion Archives, University of Connecticut., 2013. Available online at www.ropercenter.uconn.edu/data_access/data/search_for_datasets.html (accessed May 2, 2013).
Review
A tree diagram use branches to show the different outcomes of experiments and makes complex probability questions easy to visualize. A Venn diagram is a picture that represents the outcomes of an experiment. It generally consists of a box that represents the sample space S together with circles or ovals. The circles or ovals represent events. A Venn diagram is especially helpful for visualizing the OR event, the AND event, and the complement of an event and for understanding conditional probabilities.
Glossary
- Tree Diagram
- the useful visual representation of a sample space and events in the form of a “tree” with branches marked by possible outcomes together with associated probabilities (frequencies, relative frequencies)
- Venn Diagram
- the visual representation of a sample space and events in the form of circles or ovals showing their intersections