
9.E: Introduction to t-tests (Exercises)
- Page ID
- 14506

\( \newcommand{\vecs}[1]{\overset { \scriptstyle \rightharpoonup} {\mathbf{#1}} } \)
\( \newcommand{\vecd}[1]{\overset{-\!-\!\rightharpoonup}{\vphantom{a}\smash {#1}}} \)
\( \newcommand{\id}{\mathrm{id}}\) \( \newcommand{\Span}{\mathrm{span}}\)
( \newcommand{\kernel}{\mathrm{null}\,}\) \( \newcommand{\range}{\mathrm{range}\,}\)
\( \newcommand{\RealPart}{\mathrm{Re}}\) \( \newcommand{\ImaginaryPart}{\mathrm{Im}}\)
\( \newcommand{\Argument}{\mathrm{Arg}}\) \( \newcommand{\norm}[1]{\| #1 \|}\)
\( \newcommand{\inner}[2]{\langle #1, #2 \rangle}\)
\( \newcommand{\Span}{\mathrm{span}}\)
\( \newcommand{\id}{\mathrm{id}}\)
\( \newcommand{\Span}{\mathrm{span}}\)
\( \newcommand{\kernel}{\mathrm{null}\,}\)
\( \newcommand{\range}{\mathrm{range}\,}\)
\( \newcommand{\RealPart}{\mathrm{Re}}\)
\( \newcommand{\ImaginaryPart}{\mathrm{Im}}\)
\( \newcommand{\Argument}{\mathrm{Arg}}\)
\( \newcommand{\norm}[1]{\| #1 \|}\)
\( \newcommand{\inner}[2]{\langle #1, #2 \rangle}\)
\( \newcommand{\Span}{\mathrm{span}}\) \( \newcommand{\AA}{\unicode[.8,0]{x212B}}\)
\( \newcommand{\vectorA}[1]{\vec{#1}} % arrow\)
\( \newcommand{\vectorAt}[1]{\vec{\text{#1}}} % arrow\)
\( \newcommand{\vectorB}[1]{\overset { \scriptstyle \rightharpoonup} {\mathbf{#1}} } \)
\( \newcommand{\vectorC}[1]{\textbf{#1}} \)
\( \newcommand{\vectorD}[1]{\overrightarrow{#1}} \)
\( \newcommand{\vectorDt}[1]{\overrightarrow{\text{#1}}} \)
\( \newcommand{\vectE}[1]{\overset{-\!-\!\rightharpoonup}{\vphantom{a}\smash{\mathbf {#1}}}} \)
\( \newcommand{\vecs}[1]{\overset { \scriptstyle \rightharpoonup} {\mathbf{#1}} } \)
\( \newcommand{\vecd}[1]{\overset{-\!-\!\rightharpoonup}{\vphantom{a}\smash {#1}}} \)
\(\newcommand{\avec}{\mathbf a}\) \(\newcommand{\bvec}{\mathbf b}\) \(\newcommand{\cvec}{\mathbf c}\) \(\newcommand{\dvec}{\mathbf d}\) \(\newcommand{\dtil}{\widetilde{\mathbf d}}\) \(\newcommand{\evec}{\mathbf e}\) \(\newcommand{\fvec}{\mathbf f}\) \(\newcommand{\nvec}{\mathbf n}\) \(\newcommand{\pvec}{\mathbf p}\) \(\newcommand{\qvec}{\mathbf q}\) \(\newcommand{\svec}{\mathbf s}\) \(\newcommand{\tvec}{\mathbf t}\) \(\newcommand{\uvec}{\mathbf u}\) \(\newcommand{\vvec}{\mathbf v}\) \(\newcommand{\wvec}{\mathbf w}\) \(\newcommand{\xvec}{\mathbf x}\) \(\newcommand{\yvec}{\mathbf y}\) \(\newcommand{\zvec}{\mathbf z}\) \(\newcommand{\rvec}{\mathbf r}\) \(\newcommand{\mvec}{\mathbf m}\) \(\newcommand{\zerovec}{\mathbf 0}\) \(\newcommand{\onevec}{\mathbf 1}\) \(\newcommand{\real}{\mathbb R}\) \(\newcommand{\twovec}[2]{\left[\begin{array}{r}#1 \\ #2 \end{array}\right]}\) \(\newcommand{\ctwovec}[2]{\left[\begin{array}{c}#1 \\ #2 \end{array}\right]}\) \(\newcommand{\threevec}[3]{\left[\begin{array}{r}#1 \\ #2 \\ #3 \end{array}\right]}\) \(\newcommand{\cthreevec}[3]{\left[\begin{array}{c}#1 \\ #2 \\ #3 \end{array}\right]}\) \(\newcommand{\fourvec}[4]{\left[\begin{array}{r}#1 \\ #2 \\ #3 \\ #4 \end{array}\right]}\) \(\newcommand{\cfourvec}[4]{\left[\begin{array}{c}#1 \\ #2 \\ #3 \\ #4 \end{array}\right]}\) \(\newcommand{\fivevec}[5]{\left[\begin{array}{r}#1 \\ #2 \\ #3 \\ #4 \\ #5 \\ \end{array}\right]}\) \(\newcommand{\cfivevec}[5]{\left[\begin{array}{c}#1 \\ #2 \\ #3 \\ #4 \\ #5 \\ \end{array}\right]}\) \(\newcommand{\mattwo}[4]{\left[\begin{array}{rr}#1 \amp #2 \\ #3 \amp #4 \\ \end{array}\right]}\) \(\newcommand{\laspan}[1]{\text{Span}\{#1\}}\) \(\newcommand{\bcal}{\cal B}\) \(\newcommand{\ccal}{\cal C}\) \(\newcommand{\scal}{\cal S}\) \(\newcommand{\wcal}{\cal W}\) \(\newcommand{\ecal}{\cal E}\) \(\newcommand{\coords}[2]{\left\{#1\right\}_{#2}}\) \(\newcommand{\gray}[1]{\color{gray}{#1}}\) \(\newcommand{\lgray}[1]{\color{lightgray}{#1}}\) \(\newcommand{\rank}{\operatorname{rank}}\) \(\newcommand{\row}{\text{Row}}\) \(\newcommand{\col}{\text{Col}}\) \(\renewcommand{\row}{\text{Row}}\) \(\newcommand{\nul}{\text{Nul}}\) \(\newcommand{\var}{\text{Var}}\) \(\newcommand{\corr}{\text{corr}}\) \(\newcommand{\len}[1]{\left|#1\right|}\) \(\newcommand{\bbar}{\overline{\bvec}}\) \(\newcommand{\bhat}{\widehat{\bvec}}\) \(\newcommand{\bperp}{\bvec^\perp}\) \(\newcommand{\xhat}{\widehat{\xvec}}\) \(\newcommand{\vhat}{\widehat{\vvec}}\) \(\newcommand{\uhat}{\widehat{\uvec}}\) \(\newcommand{\what}{\widehat{\wvec}}\) \(\newcommand{\Sighat}{\widehat{\Sigma}}\) \(\newcommand{\lt}{<}\) \(\newcommand{\gt}{>}\) \(\newcommand{\amp}{&}\) \(\definecolor{fillinmathshade}{gray}{0.9}\)- What is the difference between a \(z\)-test and a 1-sample \(t\)-test?
- Answer:
-
A \(z\)-test uses population standard deviation for calculating standard error and gets critical values based on the standard normal distribution. A \(t\)-test uses sample standard deviation as an estimate when calculating standard error and gets critical values from the t-distribution based on degrees of freedom.
- What does a confidence interval represent?
- What is the relationship between a chosen level of confidence for a confidence interval and how wide that interval is? For instance, if you move from a 95% CI to a 90% CI, what happens? Hint: look at the t-table to see how critical values change when you change levels of significance.
- Answer:
-
As the level of confidence gets higher, the interval gets wider. In order to speak with more confidence about having found the population mean, you need to cast a wider net. This happens because critical values for higher confidence levels are larger, which creates a wider margin of error.
- Construct a confidence interval around the sample mean \(M\)= 25 for the following conditions:
- \(N\) = 25, \(s\) = 15, 95% confidence level
- \(N\) = 25, \(s\) = 15, 90% confidence level
- \(s_{M}\) = 4.5, \(α\) = 0.05, \(df\) = 20
- \(s\) = 12, \(df\) = 16 (yes, that is all the information you need)
- True or False: a confidence interval represents the most likely location of the true population mean.
- Answer:
-
False: a confidence interval is a range of plausible scores that may or may not bracket the true population mean.
- You hear that college campuses may differ from the general population in terms of political affiliation, and you want to use hypothesis testing to see if this is true and, if so, how big the difference is. You know that the average political affiliation in the nation is \(μ\) = 4.00 on a scale of 1.00 to 7.00, so you gather data from 150 college students across the nation to see if there is a difference. You find that the average score is 3.76 with a standard deviation of 1.52. Use a 1-sample \(t\)-test to see if there is a difference at the \(α\) = 0.05 level.
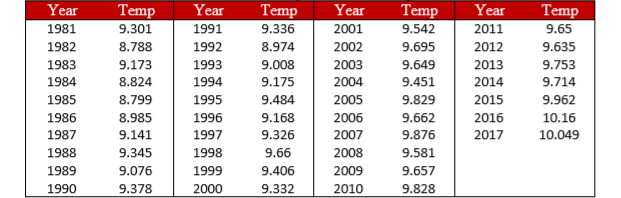
- You hear a lot of talk about increasing global temperature, so you decide to see for yourself if there has been an actual change in recent years. You know that the average land temperature from 1951-1980 was 8.79 degrees Celsius. You find annual average temperature data from 1981-2017 and decide to construct a 99% confidence interval (because you want to be as sure as possible and look for differences in both directions, not just one) using this data to test for a difference from the previous average.
- Answer:
-
\(M\)= 9.44, \(s\) = 0.35, \(s_{M}\)= 0.06, \(df\) = 36, \(t*\) = 2.719, 99% CI = (9.28, 9.60); CI does not bracket \(μ\), reject null hypothesis. \(d\) = 1.83
- Determine whether you would reject or fail to reject the null hypothesis in the following situations:
- \(t\) = 2.58, \(N\) = 21, two-tailed test at \(α\) = 0.05
- \(t\) = 1.99, \(N\) = 49, one-tailed test at \(α\) = 0.01
- \(μ\) = 47.82, 99% CI = (48.71, 49.28)
- \(μ\) = 0, 95% CI = (-0.15, 0.20)
- You are curious about how people feel about craft beer, so you gather data from 55 people in the city on whether or not they like it. You code your data so that 0 is neutral, positive scores indicate liking craft beer, and negative scores indicate disliking craft beer. You find that the average opinion was \(M\)= 1.10 and the spread was \(s\) = 0.40, and you test for a difference from 0 at the \(α\) = 0.05 level.
- Answer:
-
Step 1: \(H_0: μ = 0\) “The average person has a neutral opinion towards craft beer”, \(H_A: μ ≠ 0\) “Overall people will have an opinion about craft beer, either good or bad.”
Step 2: Two-tailed test, \(df\) = 54, \(t*\) = 2.009.
Step 3: \(\overline{X}\)= 1.10, \(s_{\overline{X}}\)= 0.05, \(t\) = 22.00.
Step 4: \(t > t*\), Reject \(H_0\).
Based on opinions from 55 people, we can conclude that the average opinion of craft beer (\(M\)= 1.10) is positive, \(t(54)\) = 22.00, \(p\) < .05. Since the result is significant, we need an effect size: Cohen’s \(d\) = 2.75, which is a large effect.
- You want to know if college students have more stress in their daily lives than the general population (\(μ\) = 12), so you gather data from 25 people to test your hypothesis. Your sample has an average stress score of \(M\)= 13.11 and a standard deviation of \(s\) = 3.89. Use a 1-sample \(t\)-test to see if there is a difference.
Contributors and Attributions
Foster et al. (University of Missouri-St. Louis, Rice University, & University of Houston, Downtown Campus)