Statistics LibreTexts

10.6: Influential Observations

  • Page ID
    28962
  • \( \newcommand{\vecs}[1]{\overset { \scriptstyle \rightharpoonup} {\mathbf{#1}} } \)

    \( \newcommand{\vecd}[1]{\overset{-\!-\!\rightharpoonup}{\vphantom{a}\smash {#1}}} \)

    \( \newcommand{\id}{\mathrm{id}}\) \( \newcommand{\Span}{\mathrm{span}}\)

    ( \newcommand{\kernel}{\mathrm{null}\,}\) \( \newcommand{\range}{\mathrm{range}\,}\)

    \( \newcommand{\RealPart}{\mathrm{Re}}\) \( \newcommand{\ImaginaryPart}{\mathrm{Im}}\)

    \( \newcommand{\Argument}{\mathrm{Arg}}\) \( \newcommand{\norm}[1]{\| #1 \|}\)

    \( \newcommand{\inner}[2]{\langle #1, #2 \rangle}\)

    \( \newcommand{\Span}{\mathrm{span}}\)

    \( \newcommand{\id}{\mathrm{id}}\)

    \( \newcommand{\Span}{\mathrm{span}}\)

    \( \newcommand{\kernel}{\mathrm{null}\,}\)

    \( \newcommand{\range}{\mathrm{range}\,}\)

    \( \newcommand{\RealPart}{\mathrm{Re}}\)

    \( \newcommand{\ImaginaryPart}{\mathrm{Im}}\)

    \( \newcommand{\Argument}{\mathrm{Arg}}\)

    \( \newcommand{\norm}[1]{\| #1 \|}\)

    \( \newcommand{\inner}[2]{\langle #1, #2 \rangle}\)

    \( \newcommand{\Span}{\mathrm{span}}\) \( \newcommand{\AA}{\unicode[.8,0]{x212B}}\)

    \( \newcommand{\vectorA}[1]{\vec{#1}}      % arrow\)

    \( \newcommand{\vectorAt}[1]{\vec{\text{#1}}}      % arrow\)

    \( \newcommand{\vectorB}[1]{\overset { \scriptstyle \rightharpoonup} {\mathbf{#1}} } \)

    \( \newcommand{\vectorC}[1]{\textbf{#1}} \)

    \( \newcommand{\vectorD}[1]{\overrightarrow{#1}} \)

    \( \newcommand{\vectorDt}[1]{\overrightarrow{\text{#1}}} \)

    \( \newcommand{\vectE}[1]{\overset{-\!-\!\rightharpoonup}{\vphantom{a}\smash{\mathbf {#1}}}} \)

    \( \newcommand{\vecs}[1]{\overset { \scriptstyle \rightharpoonup} {\mathbf{#1}} } \)

    \( \newcommand{\vecd}[1]{\overset{-\!-\!\rightharpoonup}{\vphantom{a}\smash {#1}}} \)

    \(\newcommand{\avec}{\mathbf a}\) \(\newcommand{\bvec}{\mathbf b}\) \(\newcommand{\cvec}{\mathbf c}\) \(\newcommand{\dvec}{\mathbf d}\) \(\newcommand{\dtil}{\widetilde{\mathbf d}}\) \(\newcommand{\evec}{\mathbf e}\) \(\newcommand{\fvec}{\mathbf f}\) \(\newcommand{\nvec}{\mathbf n}\) \(\newcommand{\pvec}{\mathbf p}\) \(\newcommand{\qvec}{\mathbf q}\) \(\newcommand{\svec}{\mathbf s}\) \(\newcommand{\tvec}{\mathbf t}\) \(\newcommand{\uvec}{\mathbf u}\) \(\newcommand{\vvec}{\mathbf v}\) \(\newcommand{\wvec}{\mathbf w}\) \(\newcommand{\xvec}{\mathbf x}\) \(\newcommand{\yvec}{\mathbf y}\) \(\newcommand{\zvec}{\mathbf z}\) \(\newcommand{\rvec}{\mathbf r}\) \(\newcommand{\mvec}{\mathbf m}\) \(\newcommand{\zerovec}{\mathbf 0}\) \(\newcommand{\onevec}{\mathbf 1}\) \(\newcommand{\real}{\mathbb R}\) \(\newcommand{\twovec}[2]{\left[\begin{array}{r}#1 \\ #2 \end{array}\right]}\) \(\newcommand{\ctwovec}[2]{\left[\begin{array}{c}#1 \\ #2 \end{array}\right]}\) \(\newcommand{\threevec}[3]{\left[\begin{array}{r}#1 \\ #2 \\ #3 \end{array}\right]}\) \(\newcommand{\cthreevec}[3]{\left[\begin{array}{c}#1 \\ #2 \\ #3 \end{array}\right]}\) \(\newcommand{\fourvec}[4]{\left[\begin{array}{r}#1 \\ #2 \\ #3 \\ #4 \end{array}\right]}\) \(\newcommand{\cfourvec}[4]{\left[\begin{array}{c}#1 \\ #2 \\ #3 \\ #4 \end{array}\right]}\) \(\newcommand{\fivevec}[5]{\left[\begin{array}{r}#1 \\ #2 \\ #3 \\ #4 \\ #5 \\ \end{array}\right]}\) \(\newcommand{\cfivevec}[5]{\left[\begin{array}{c}#1 \\ #2 \\ #3 \\ #4 \\ #5 \\ \end{array}\right]}\) \(\newcommand{\mattwo}[4]{\left[\begin{array}{rr}#1 \amp #2 \\ #3 \amp #4 \\ \end{array}\right]}\) \(\newcommand{\laspan}[1]{\text{Span}\{#1\}}\) \(\newcommand{\bcal}{\cal B}\) \(\newcommand{\ccal}{\cal C}\) \(\newcommand{\scal}{\cal S}\) \(\newcommand{\wcal}{\cal W}\) \(\newcommand{\ecal}{\cal E}\) \(\newcommand{\coords}[2]{\left\{#1\right\}_{#2}}\) \(\newcommand{\gray}[1]{\color{gray}{#1}}\) \(\newcommand{\lgray}[1]{\color{lightgray}{#1}}\) \(\newcommand{\rank}{\operatorname{rank}}\) \(\newcommand{\row}{\text{Row}}\) \(\newcommand{\col}{\text{Col}}\) \(\renewcommand{\row}{\text{Row}}\) \(\newcommand{\nul}{\text{Nul}}\) \(\newcommand{\var}{\text{Var}}\) \(\newcommand{\corr}{\text{corr}}\) \(\newcommand{\len}[1]{\left|#1\right|}\) \(\newcommand{\bbar}{\overline{\bvec}}\) \(\newcommand{\bhat}{\widehat{\bvec}}\) \(\newcommand{\bperp}{\bvec^\perp}\) \(\newcommand{\xhat}{\widehat{\xvec}}\) \(\newcommand{\vhat}{\widehat{\vvec}}\) \(\newcommand{\uhat}{\widehat{\uvec}}\) \(\newcommand{\what}{\widehat{\wvec}}\) \(\newcommand{\Sighat}{\widehat{\Sigma}}\) \(\newcommand{\lt}{<}\) \(\newcommand{\gt}{>}\) \(\newcommand{\amp}{&}\) \(\definecolor{fillinmathshade}{gray}{0.9}\)

    Learning Objectives

    • Describe what makes a point influential
    • Define "distance"

    It is possible for a single observation to have a great influence on the results of a regression analysis. It is therefore important to be alert to the possibility of influential observations and to take them into consideration when interpreting the results.

    Influence

    The influence of an observation can be thought of in terms of how much the predicted scores for other observations would differ if the observation in question were not included. Cook's D is a good measure of the influence of an observation and is proportional to the sum of the squared differences between predictions made with all observations in the analysis and predictions made leaving out the observation in question. If the predictions are the same with or without the observation in question, then the observation has no influence on the regression model. If the predictions differ greatly when the observation is not included in the analysis, then the observation is influential.

    A common rule of thumb is that an observation with a value of Cook's D over \(1.0\) has too much influence. As with all rules of thumb, this rule should be applied judiciously and not thoughtlessly.

    An observation's influence is a function of two factors:

    1. How much the observation's value on the predictor variable differs from the mean of the predictor variable and
    2. The difference between the predicted score for the observation and its actual score.

    The former factor is called the observation's leverage. The latter factor is called the observation's distance.

    Calculation of Cook's D (Optional)

    The first step in calculating the value of Cook's D for an observation is to predict all the scores in the data once using a regression equation based on all the observations and once using all the observations except the observation in question. The second step is to compute the sum of the squared differences between these two sets of predictions. The final step is to divide this result by \(2\) times the \(MSE\) (see the section on partitioning the variance).

    Leverage

    The leverage of an observation is based on how much the observation's value on the predictor variable differs from the mean of the predictor variable. The greater an observation's leverage, the more potential it has to be an influential observation. For example, an observation with a value equal to the mean on the predictor variable has no influence on the slope of the regression line regardless of its value on the criterion variable. On the other hand, an observation that is extreme on the predictor variable has the potential to affect the slope greatly.

    Calculation of Leverage (h)

    The first step is to standardize the predictor variable so that it has a mean of \(0\) and a standard deviation of \(1\). Then, the leverage (\(h\)) is computed by squaring the observation's value on the standardized predictor variable, adding \(1\), and dividing by the number of observations.

    Distance

    The distance of an observation is based on the error of prediction for the observation: The greater the error of prediction, the greater the distance. The most commonly used measure of distance is the \(\textit{studentized residual}\). The \(\textit{studentized residual}\) for an observation is closely related to the error of prediction for that observation divided by the standard deviation of the errors of prediction. However, the predicted score is derived from a regression equation in which the observation in question is not counted. The details of the computation of a \(\textit{studentized residual}\) are a bit complex and are beyond the scope of this work.

    Even an observation with a large distance will not have that much influence if its leverage is low. It is the combination of an observation's leverage and distance that determines its influence.

    Example \(\PageIndex{1}\)

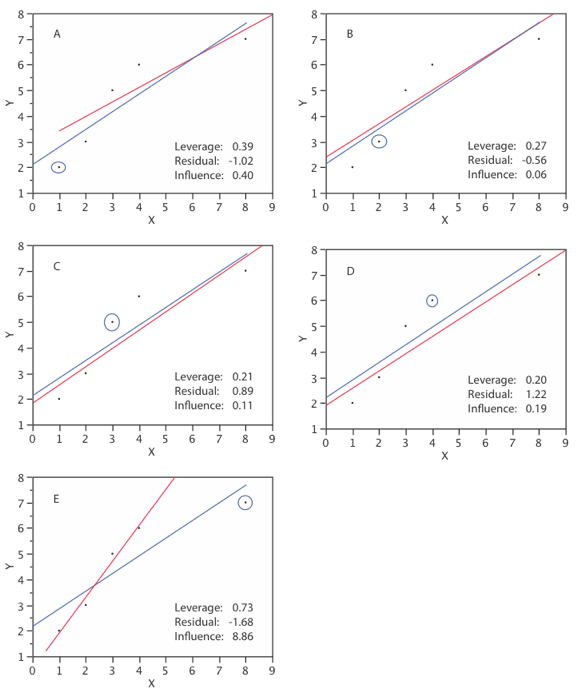
    Table \(\PageIndex{1}\) shows the leverage, \(\textit{studentized residual}\), and influence for each of the five observations in a small dataset.

    Table \(\PageIndex{1}\): Example Data

    ID X Y h R D
    A 1 2 0.39 -1.02 0.40
    B 2 3 0.27 -0.56 0.06
    C 3 5 0.21 0.89 0.11
    D 4 6 0.20 1.22 0.19
    E 8 7 0.73 -1.68 8.86

    In the above table, \(h\) is the leverage, \(R\) is the \(\textit{studentized residual}\), and \(D\) is Cook's measure of influence.

    \(\text{Observation A}\) has fairly high leverage, a relatively high residual, and moderately high influence.

    \(\text{Observation B}\) has small leverage and a relatively small residual. It has very little influence.

    \(\text{Observation C}\) has small leverage and a relatively high residual. The influence is relatively low.

    \(\text{Observation D}\) has the lowest leverage and the second highest residual. Although its residual is much higher than \(\text{Observation A }\), its influence is much less because of its low leverage.

    \(\text{Observation E}\) has by far the largest leverage and the largest residual. This combination of high leverage and high residual makes this observation extremely influential.

    Figure \(\PageIndex{1}\) shows the regression line for the whole dataset (blue) and the regression line if the observation in question is not included (red) for all observations. The observation in question is circled. Naturally, the regression line for the whole dataset is the same in all panels. The residual is calculated relative to the line for which the observation in question is not included in the analysis. The most influential observation is \(\text{Observation E}\) for which the two regression lines are very different. This indicates the influence of this observation.

    influence.jpg
    Figure \(\PageIndex{1}\): Illustration of leverage, residual, and influence. The circled points are not included in the calculation of the red regression line. All points are included in the calculation of the blue regression line.

    This page titled 10.6: Influential Observations is shared under a Public Domain license and was authored, remixed, and/or curated by David Lane via source content that was edited to the style and standards of the LibreTexts platform.