
Lab Assignment 2.5, 2.6, 2.7
- Page ID
- 36473
\( \newcommand{\vecs}[1]{\overset { \scriptstyle \rightharpoonup} {\mathbf{#1}} } \)
\( \newcommand{\vecd}[1]{\overset{-\!-\!\rightharpoonup}{\vphantom{a}\smash {#1}}} \)
\( \newcommand{\id}{\mathrm{id}}\) \( \newcommand{\Span}{\mathrm{span}}\)
( \newcommand{\kernel}{\mathrm{null}\,}\) \( \newcommand{\range}{\mathrm{range}\,}\)
\( \newcommand{\RealPart}{\mathrm{Re}}\) \( \newcommand{\ImaginaryPart}{\mathrm{Im}}\)
\( \newcommand{\Argument}{\mathrm{Arg}}\) \( \newcommand{\norm}[1]{\| #1 \|}\)
\( \newcommand{\inner}[2]{\langle #1, #2 \rangle}\)
\( \newcommand{\Span}{\mathrm{span}}\)
\( \newcommand{\id}{\mathrm{id}}\)
\( \newcommand{\Span}{\mathrm{span}}\)
\( \newcommand{\kernel}{\mathrm{null}\,}\)
\( \newcommand{\range}{\mathrm{range}\,}\)
\( \newcommand{\RealPart}{\mathrm{Re}}\)
\( \newcommand{\ImaginaryPart}{\mathrm{Im}}\)
\( \newcommand{\Argument}{\mathrm{Arg}}\)
\( \newcommand{\norm}[1]{\| #1 \|}\)
\( \newcommand{\inner}[2]{\langle #1, #2 \rangle}\)
\( \newcommand{\Span}{\mathrm{span}}\) \( \newcommand{\AA}{\unicode[.8,0]{x212B}}\)
\( \newcommand{\vectorA}[1]{\vec{#1}} % arrow\)
\( \newcommand{\vectorAt}[1]{\vec{\text{#1}}} % arrow\)
\( \newcommand{\vectorB}[1]{\overset { \scriptstyle \rightharpoonup} {\mathbf{#1}} } \)
\( \newcommand{\vectorC}[1]{\textbf{#1}} \)
\( \newcommand{\vectorD}[1]{\overrightarrow{#1}} \)
\( \newcommand{\vectorDt}[1]{\overrightarrow{\text{#1}}} \)
\( \newcommand{\vectE}[1]{\overset{-\!-\!\rightharpoonup}{\vphantom{a}\smash{\mathbf {#1}}}} \)
\( \newcommand{\vecs}[1]{\overset { \scriptstyle \rightharpoonup} {\mathbf{#1}} } \)
\( \newcommand{\vecd}[1]{\overset{-\!-\!\rightharpoonup}{\vphantom{a}\smash {#1}}} \)
Name:__________________________________________Date:____________________Row:________
Lab Assignment 2.5, 2.6, 2.7
1. The most obese countries in the world have obesity rates that range from 11.4% to 74.6%. This data is summarized in the following table.
| Percent of Population Obese | Number of Countries |
| 11.45-20.44 | 29 |
| 20.45-29.44 | 13 |
| 29.45-38.33 | 4 |
| 38.45-47.44 | 0 |
| 47.45-56.44 | 2 |
| 56.45-65.44 | 1 |
| 65.45-74.44 | 0 |
| 74.45-83.44 | 1 |
a. What is the best estimate of the mean obesity percentage for these countries?
b. The United States has an average obesity rate of 33.9%. Is this rate above average or below?
2. Use the following information to answer the next three exercises: The following data show the lengths of boats moored in a marina. The data are ordered from smallest to largest: 16; 17; 19; 20; 20; 21; 23; 24; 25; 25; 25; 26; 26; 27; 27; 27; 28; 29; 30; 32; 33; 33; 34; 35; 37; 39; 40
a. Calculate the mean.
b. Identify the median.
c. Identify the mode.
d. Calculate the standard deviation.
e. Calculate the variance.
3. The table gives the percent of children under five considered to be underweight.
| Percent of Underweight Children | Number of Countries |
| 16.00-21.44 | 23 |
| 21.45-26.89 | 4 |
| 26.90-32.34 | 9 |
| 32.35-37.79 | 7 |
| 37.80-43.24 | 6 |
| 43.25-48.69 | 1 |
a. What is the best estimate for the mean percentage of underweight children?
b. What is the standard deviation and variance?
4. When the data are skewed left, what is the typical relationship between the mean and median?
5. When the data are symmetrical, what is the typical relationship between the mean and median?
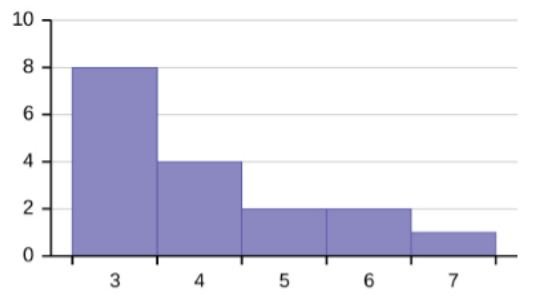
6. Describe the shape of this distribution and describe the relationship between the mean and the median of this distribution.
7. Use the following information to answer the next two exercises: The following data are the distances between 20 retail stores and a large distribution center. The distances are in miles.
29; 37; 38; 40; 58; 67; 68; 69; 76; 86; 87; 95; 96; 96; 99; 106; 112; 127; 145; 150
a. Find the mean and standard deviation and round to the nearest tenth.
b. Find the value that is one standard deviation below the mean.
8. Two baseball players, Fredo and Karl, on different teams wanted to find out who had the higher batting average when compared to his team. Which baseball player had the higher batting average when compared to his team?
| Baseball Player | Batting Average | Team Batting Average | Team Standard Deviation |
| Fredo | 0.158 | 0.166 | 0.012 |
| Karl | 0.177 | 0.189 | 0.015 |