There is an interaction effect (or just “interaction”) when the effect of one independent variable depends on the level of another. Although this might seem complicated, you already have an intuitive understanding of interactions. As an everyday example, assume your friend asks you to go to a movie with another friend. Your response to her is, “well it depends on which movie you are going to see and who else is coming.” You really want to see the big blockbuster summer hit but have little interest in seeing the cheesy romantic comedy. In other words, there is a main effect of type of movie on your decision. If your decision to go to see either of these movies further depends on who she is bringing with her then there is an interaction. For instance, if you will go to see the big blockbuster summer hit if she brings her cool friend you get along with, but you will not go to this movie if she brings her boring friend, then there is an interaction.
Let’s now consider some examples of interactions from research. It probably would not surprise you to hear that the effect of receiving psychotherapy is stronger among people who are highly motivated to change than among people who are not motivated to change. This is an interaction because the effect of one independent variable (whether or not one receives psychotherapy) depends on the level of another (motivation to change).
In many studies, the primary research question is about an interaction. The study by Brown and her colleagues was inspired by the idea that people with hypochondriasis are especially attentive to any negative health-related information. This led to the hypothesis that people high in hypochondriasis would recall negative health-related words more accurately than people low in hypochondriasis but recall non-health-related words about the same as people low in hypochondriasis. And of course, this is exactly what happened in this study.
Types of Interactions
The effect of one independent variable can depend on the level of the other in several different ways. Note that these different types of interactions are simply nice to know in case you read about them in the manuscripts. But the ultimate goal is to understand what interaction means (when the effect of one IV on DV depends on the level of another IV) and what it looks like (see the panels and bars below). Here we go.
First, there can be spreading interactions.Examples of spreading interactions are shown in the top two panels of Figure \(\PageIndex{2}\). In the top panel, independent variable “B” has an effect at level 1 of independent variable “A” (there is a difference in the height of the blue and red bars on the left side of the graph) but no effect at level 2 of independent variable “A.” (there is no difference in the height of the blue and red bars on the right side of the graph). In the middle panel, independent variable “B” has a stronger effect at level 1 of independent variable “A” than at level 2 (there is a larger difference in the height of the blue and red bars on the left side of the graph and a smaller difference in the height of the blue and red bars on the right side of the graph). So to summarize, for spreading interactions there is an effect of one independent variable at one level of the other independent variable and there is either a weak effect or no effect of that independent variable at the other level of the other independent variable.
The second type of interaction that can be found is a cross-over interaction. A cross-over interaction is depicted in the bottom panel of Figure \(\PageIndex{2}\), independent variable “B” again has an effect at both levels of independent variable “A,” but the effects are in opposite directions. An example of a crossover interaction comes from a study by Kathy Gilliland on the effect of caffeine on the verbal test scores of introverts and extraverts (Gilliland, 1980). Introverts perform better than extraverts when they have not ingested any caffeine. But extraverts perform better than introverts when they have ingested 4 mg of caffeine per kilogram of body weight.
Figure \(\PageIndex{2}\): Bar Graphs Showing Three Types of Interactions. In the top panel, one independent variable has an effect at one level of the second independent variable but not at the other. In the middle panel, one independent variable has a stronger effect at one level of the second independent variable than at the other. In the bottom panel, one independent variable has the opposite effect at one level of the second independent variable than at the other.
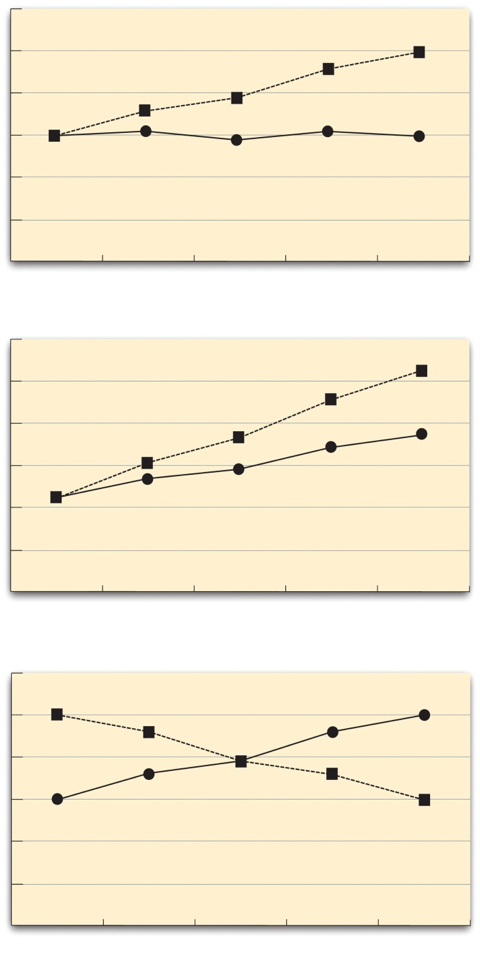
Figure \(\PageIndex{3}\) shows examples of these same kinds of interactions when one of the independent variables is quantitative and the results are plotted in a line graph. Note that the top two figures depict the two kinds of spreading interactions that can be found while the bottom figure depicts a crossover interaction (the two lines literally “cross over” each other).
Figure \(\PageIndex{3}\): Line Graphs Showing Different Types of Interactions. In the top panel, one independent variable has an effect at one level of the second independent variable but not at the other. In the middle panel, one independent variable has a stronger effect at one level of the second independent variable than at the other. In the bottom panel, one independent variable has the opposite effect at one level of the second independent variable than at the other.
References
Gilliland, K. (1980). The interactive effect of introversion-extraversion with caffeine induced arousal on verbal performance. Journal of Research in Personality, 14, 482–492.