
1.2: Slope of a Line
- Page ID
- 35194

\( \newcommand{\vecs}[1]{\overset { \scriptstyle \rightharpoonup} {\mathbf{#1}} } \)
\( \newcommand{\vecd}[1]{\overset{-\!-\!\rightharpoonup}{\vphantom{a}\smash {#1}}} \)
\( \newcommand{\id}{\mathrm{id}}\) \( \newcommand{\Span}{\mathrm{span}}\)
( \newcommand{\kernel}{\mathrm{null}\,}\) \( \newcommand{\range}{\mathrm{range}\,}\)
\( \newcommand{\RealPart}{\mathrm{Re}}\) \( \newcommand{\ImaginaryPart}{\mathrm{Im}}\)
\( \newcommand{\Argument}{\mathrm{Arg}}\) \( \newcommand{\norm}[1]{\| #1 \|}\)
\( \newcommand{\inner}[2]{\langle #1, #2 \rangle}\)
\( \newcommand{\Span}{\mathrm{span}}\)
\( \newcommand{\id}{\mathrm{id}}\)
\( \newcommand{\Span}{\mathrm{span}}\)
\( \newcommand{\kernel}{\mathrm{null}\,}\)
\( \newcommand{\range}{\mathrm{range}\,}\)
\( \newcommand{\RealPart}{\mathrm{Re}}\)
\( \newcommand{\ImaginaryPart}{\mathrm{Im}}\)
\( \newcommand{\Argument}{\mathrm{Arg}}\)
\( \newcommand{\norm}[1]{\| #1 \|}\)
\( \newcommand{\inner}[2]{\langle #1, #2 \rangle}\)
\( \newcommand{\Span}{\mathrm{span}}\) \( \newcommand{\AA}{\unicode[.8,0]{x212B}}\)
\( \newcommand{\vectorA}[1]{\vec{#1}} % arrow\)
\( \newcommand{\vectorAt}[1]{\vec{\text{#1}}} % arrow\)
\( \newcommand{\vectorB}[1]{\overset { \scriptstyle \rightharpoonup} {\mathbf{#1}} } \)
\( \newcommand{\vectorC}[1]{\textbf{#1}} \)
\( \newcommand{\vectorD}[1]{\overrightarrow{#1}} \)
\( \newcommand{\vectorDt}[1]{\overrightarrow{\text{#1}}} \)
\( \newcommand{\vectE}[1]{\overset{-\!-\!\rightharpoonup}{\vphantom{a}\smash{\mathbf {#1}}}} \)
\( \newcommand{\vecs}[1]{\overset { \scriptstyle \rightharpoonup} {\mathbf{#1}} } \)
\( \newcommand{\vecd}[1]{\overset{-\!-\!\rightharpoonup}{\vphantom{a}\smash {#1}}} \)
In this section, you will learn to:
- Find the slope of a line.
- Graph the line if a point and the slope are given.
In the last section, we learned to graph a line by choosing two points on the line. A graph of a line can also be determined if one point and the "steepness" of the line is known. The number that refers to the steepness or inclination of a line is called the slope of the line.
From previous math courses, many of you remember slope as the "rise over run," or "the vertical change over the horizontal change" and have often seen it expressed as:
\[\frac{\text {rise}}{\text {run}}, \frac{\text {vertical change}}{\text {horizontal change}}, \frac{\Delta y}{\Delta x} \text { etc. } \nonumber \]
We give a precise definition.
If (\(x_1\), \(y_1\)) and (\(x_2\), \(y_2\)) are two different points on a line, the slope of the line is
\[\text{slope}=m=\frac{y_2-y_1}{x_2-x_1} \label{slope} \]
Find the slope of the line passing through points (−2, 3) and (4, −1), and graph the line.
Solution
Let (\(x_1\), \(y_1\)) = (−2, 3) and (\(x_2\), \(y_2\)) = (4, −1), then the slope (via Equation \ref{slope}) is
| \(m = \frac{-1-3}{4-(-2)} = \frac{-4}{6} = -\frac{2}{3}\) | 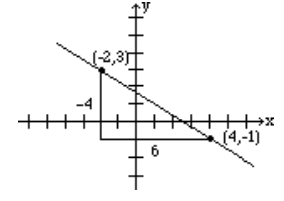 |
To give the reader a better understanding, both the vertical change, -4, and the horizontal change, 6, are shown in the above figure.
When two points are given, it does not matter which point is denoted as (\(x_1\), \(y_1\)) and which (\(x_2\), \(y_2\)). The value for the slope will be the same.
In Example \(\PageIndex{1}\), if we instead choose (\(x_1\), \(y_1\)) = (4, −1) and (\(x_2\), \(y_2\)) = (−2, 3), then we will get the same value for the slope as we obtained earlier.
The steps involved are as follows.
\[m = \frac{3-(-1)}{-2-4} = \frac{4}{-6} = -\frac{2}{3} \nonumber \]
The student should further observe that
- if a line rises when going from left to right, then it has a positive slope. In this situation, as the value of \(x\) increases, the value of \(y\) also increases
- if a line falls going from left to right, it has a negative slope; as the value of \(x\) increases, the value of \(y\) decreases.
Find the slope of the line that passes through the points (2, 3) and (2, −1), and graph.
Solution
Let (\(x_1\), \(y_1\)) = (2, 3) and (\(x_2\), \(y_2\)) = (2, −1) then the slope is
\[m = \frac{-1-3}{2-2}=\frac{4}{0}=\text{undefined.} \nonumber \]
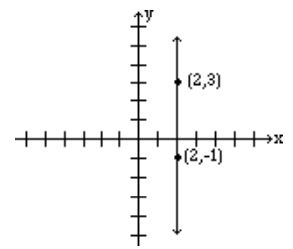
Note: The slope of a vertical line is undefined.
Find the slope of the line that passes through the points (−1, −4) and (3, −4)
Solution
Let (\(x_1\), \(y_1\)) = (−1, −4) and (\(x_2\), \(y_2\)) = (3, −4), then the slope is
\[ m = \frac{-4-(-4)}{3-(-1)} = \frac{0}{4} = 0 \nonumber \]
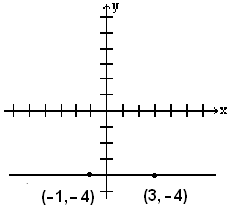
Note: The slope of a horizontal line is 0
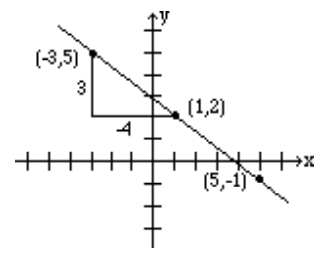
Graph the line that passes through the point (1, 2) and has slope \(-\frac{3}{4}\).
Solution
Slope equals \(\frac{\text{rise}}{\text{run}}\). The fact that the slope is \(\frac{-3}{4}\), means that for every rise of -3 units (fall of 3 units) there is a run of 4. So if from the given point (1, 2) we go down 3 units and go right 4 units, we reach the point (5, -1). The graph is obtained by connecting these two points.
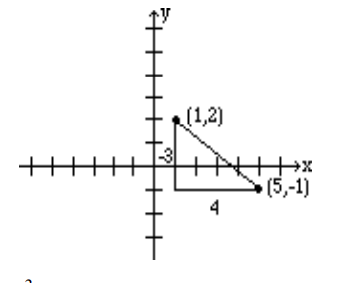
Alternatively, since \(\frac{3}{-4}\) represents the same number, the line can be drawn by starting at the point (1,2) and choosing a rise of 3 units followed by a run of -4 units. So from the point (1, 2), we go up 3 units, and to the left 4, thus reaching the point (-3, 5) which is also on the same line. See figure below.
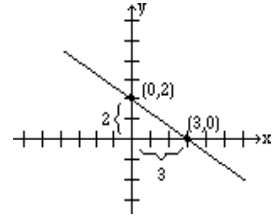
Find the slope of the line \(2x + 3y = 6\).
Solution
In order to find the slope of this line, we will choose any two points on this line.
Again, the selection of \(x\) and \(y\) intercepts seems to be a good choice. The \(x\)-intercept is (3, 0), and the \(y\)-intercept is (0, 2). Therefore, the slope is
\[m = \frac{2-0}{0-3} =-\frac{2}{3}. \nonumber \]
The graph below shows the line and the \(x\)-intercepts and \(y\)-intercepts:
Find the slope of the line \(y = 3x + 2\).
Solution
We again find two points on the line, e.g., (0, 2) and (1, 5). Therefore, the slope is
\[m =\frac{5-2}{1-0} = \frac{3}{1} = 3. \nonumber \]
Look at the slopes and the \(y\)-intercepts of the following lines.
| The line | slope | \(y\)-intercept |
|---|---|---|
| \(y=3x+2\) | 3 | 2 |
| \(y=-2x+5\) | -2 | 5 |
| \(y=\frac{3}{2}x-4\) | \(\frac{3}{2}\) | -4 |
It is no coincidence that when an equation of the line is solved for \(y\), the coefficient of the \(x\) term represents the slope, and the constant term represents the \(y\)-intercept.
In other words, for the line \(y = mx + b\), \(m\) is the slope, and \(b\) is the \(y\)-intercept.
Determine the slope and \(y\)-intercept of the line \(2x + 3y = 6\).
Solution
We solve for \(y\):
\begin{align*}
&2 x+3 y=6 \nonumber \\
&3 y=-2 x+6 \nonumber \\
&y=(-2 / 3) x+2 \nonumber
\end{align*}
The slope = the coefficient of the \(x\) term = − 2/3.
The \(y\)-intercept = the constant term = 2.