Statistics LibreTexts

5.4: The Exponential Distribution

  • Page ID
    14651
  • \( \newcommand{\vecs}[1]{\overset { \scriptstyle \rightharpoonup} {\mathbf{#1}} } \)

    \( \newcommand{\vecd}[1]{\overset{-\!-\!\rightharpoonup}{\vphantom{a}\smash {#1}}} \)

    \( \newcommand{\id}{\mathrm{id}}\) \( \newcommand{\Span}{\mathrm{span}}\)

    ( \newcommand{\kernel}{\mathrm{null}\,}\) \( \newcommand{\range}{\mathrm{range}\,}\)

    \( \newcommand{\RealPart}{\mathrm{Re}}\) \( \newcommand{\ImaginaryPart}{\mathrm{Im}}\)

    \( \newcommand{\Argument}{\mathrm{Arg}}\) \( \newcommand{\norm}[1]{\| #1 \|}\)

    \( \newcommand{\inner}[2]{\langle #1, #2 \rangle}\)

    \( \newcommand{\Span}{\mathrm{span}}\)

    \( \newcommand{\id}{\mathrm{id}}\)

    \( \newcommand{\Span}{\mathrm{span}}\)

    \( \newcommand{\kernel}{\mathrm{null}\,}\)

    \( \newcommand{\range}{\mathrm{range}\,}\)

    \( \newcommand{\RealPart}{\mathrm{Re}}\)

    \( \newcommand{\ImaginaryPart}{\mathrm{Im}}\)

    \( \newcommand{\Argument}{\mathrm{Arg}}\)

    \( \newcommand{\norm}[1]{\| #1 \|}\)

    \( \newcommand{\inner}[2]{\langle #1, #2 \rangle}\)

    \( \newcommand{\Span}{\mathrm{span}}\) \( \newcommand{\AA}{\unicode[.8,0]{x212B}}\)

    \( \newcommand{\vectorA}[1]{\vec{#1}}      % arrow\)

    \( \newcommand{\vectorAt}[1]{\vec{\text{#1}}}      % arrow\)

    \( \newcommand{\vectorB}[1]{\overset { \scriptstyle \rightharpoonup} {\mathbf{#1}} } \)

    \( \newcommand{\vectorC}[1]{\textbf{#1}} \)

    \( \newcommand{\vectorD}[1]{\overrightarrow{#1}} \)

    \( \newcommand{\vectorDt}[1]{\overrightarrow{\text{#1}}} \)

    \( \newcommand{\vectE}[1]{\overset{-\!-\!\rightharpoonup}{\vphantom{a}\smash{\mathbf {#1}}}} \)

    \( \newcommand{\vecs}[1]{\overset { \scriptstyle \rightharpoonup} {\mathbf{#1}} } \)

    \( \newcommand{\vecd}[1]{\overset{-\!-\!\rightharpoonup}{\vphantom{a}\smash {#1}}} \)

    \(\newcommand{\avec}{\mathbf a}\) \(\newcommand{\bvec}{\mathbf b}\) \(\newcommand{\cvec}{\mathbf c}\) \(\newcommand{\dvec}{\mathbf d}\) \(\newcommand{\dtil}{\widetilde{\mathbf d}}\) \(\newcommand{\evec}{\mathbf e}\) \(\newcommand{\fvec}{\mathbf f}\) \(\newcommand{\nvec}{\mathbf n}\) \(\newcommand{\pvec}{\mathbf p}\) \(\newcommand{\qvec}{\mathbf q}\) \(\newcommand{\svec}{\mathbf s}\) \(\newcommand{\tvec}{\mathbf t}\) \(\newcommand{\uvec}{\mathbf u}\) \(\newcommand{\vvec}{\mathbf v}\) \(\newcommand{\wvec}{\mathbf w}\) \(\newcommand{\xvec}{\mathbf x}\) \(\newcommand{\yvec}{\mathbf y}\) \(\newcommand{\zvec}{\mathbf z}\) \(\newcommand{\rvec}{\mathbf r}\) \(\newcommand{\mvec}{\mathbf m}\) \(\newcommand{\zerovec}{\mathbf 0}\) \(\newcommand{\onevec}{\mathbf 1}\) \(\newcommand{\real}{\mathbb R}\) \(\newcommand{\twovec}[2]{\left[\begin{array}{r}#1 \\ #2 \end{array}\right]}\) \(\newcommand{\ctwovec}[2]{\left[\begin{array}{c}#1 \\ #2 \end{array}\right]}\) \(\newcommand{\threevec}[3]{\left[\begin{array}{r}#1 \\ #2 \\ #3 \end{array}\right]}\) \(\newcommand{\cthreevec}[3]{\left[\begin{array}{c}#1 \\ #2 \\ #3 \end{array}\right]}\) \(\newcommand{\fourvec}[4]{\left[\begin{array}{r}#1 \\ #2 \\ #3 \\ #4 \end{array}\right]}\) \(\newcommand{\cfourvec}[4]{\left[\begin{array}{c}#1 \\ #2 \\ #3 \\ #4 \end{array}\right]}\) \(\newcommand{\fivevec}[5]{\left[\begin{array}{r}#1 \\ #2 \\ #3 \\ #4 \\ #5 \\ \end{array}\right]}\) \(\newcommand{\cfivevec}[5]{\left[\begin{array}{c}#1 \\ #2 \\ #3 \\ #4 \\ #5 \\ \end{array}\right]}\) \(\newcommand{\mattwo}[4]{\left[\begin{array}{rr}#1 \amp #2 \\ #3 \amp #4 \\ \end{array}\right]}\) \(\newcommand{\laspan}[1]{\text{Span}\{#1\}}\) \(\newcommand{\bcal}{\cal B}\) \(\newcommand{\ccal}{\cal C}\) \(\newcommand{\scal}{\cal S}\) \(\newcommand{\wcal}{\cal W}\) \(\newcommand{\ecal}{\cal E}\) \(\newcommand{\coords}[2]{\left\{#1\right\}_{#2}}\) \(\newcommand{\gray}[1]{\color{gray}{#1}}\) \(\newcommand{\lgray}[1]{\color{lightgray}{#1}}\) \(\newcommand{\rank}{\operatorname{rank}}\) \(\newcommand{\row}{\text{Row}}\) \(\newcommand{\col}{\text{Col}}\) \(\renewcommand{\row}{\text{Row}}\) \(\newcommand{\nul}{\text{Nul}}\) \(\newcommand{\var}{\text{Var}}\) \(\newcommand{\corr}{\text{corr}}\) \(\newcommand{\len}[1]{\left|#1\right|}\) \(\newcommand{\bbar}{\overline{\bvec}}\) \(\newcommand{\bhat}{\widehat{\bvec}}\) \(\newcommand{\bperp}{\bvec^\perp}\) \(\newcommand{\xhat}{\widehat{\xvec}}\) \(\newcommand{\vhat}{\widehat{\vvec}}\) \(\newcommand{\uhat}{\widehat{\uvec}}\) \(\newcommand{\what}{\widehat{\wvec}}\) \(\newcommand{\Sighat}{\widehat{\Sigma}}\) \(\newcommand{\lt}{<}\) \(\newcommand{\gt}{>}\) \(\newcommand{\amp}{&}\) \(\definecolor{fillinmathshade}{gray}{0.9}\)

    The exponential distribution is often concerned with the amount of time until some specific event occurs. For example, the amount of time (beginning now) until an earthquake occurs has an exponential distribution. Other examples include the length of time, in minutes, of long distance business telephone calls, and the amount of time, in months, a car battery lasts. It can be shown, too, that the value of the change that you have in your pocket or purse approximately follows an exponential distribution.

    Values for an exponential random variable occur in the following way. There are fewer large values and more small values. For example, marketing studies have shown that the amount of money customers spend in one trip to the supermarket follows an exponential distribution. There are more people who spend small amounts of money and fewer people who spend large amounts of money.

    Exponential distributions are commonly used in calculations of product reliability, or the length of time a product lasts.

    The random variable for the exponential distribution is continuous and often measures a passage of time, although it can be used in other applications. Typical questions may be, “what is the probability that some event will occur within the next \(x\) hours or days, or what is the probability that some event will occur between \(x_1\) hours and \(x_2\) hours, or what is the probability that the event will take more than \(x_1\) hours to perform?” In short, the random variable \(X\) equals (a) the time between events or (b) the passage of time to complete an action, e.g. wait on a customer. The probability density function is given by:

    \[f(x)=\frac{1}{\mu} e^{-\frac{x}{\mu}}\nonumber\]

    where \(\mu\) is the historical average waiting time.

    An alternative form of the exponential distribution formula recognizes what is often called the decay factor. The decay factor simply measures how rapidly the probability of an event declines as the random variable \(X\) increases. When the notation using the decay parameter \(\lambda\) is used, the probability density function is presented as:

    \[f(x)=\lambda e^{-\lambda x}\nonumber\]

    where \(\lambda=\frac{1}{\mu}\)

    In order to calculate probabilities for specific probability density functions, the cumulative density function is used. The cumulative density function (cdf) is simply the integral of the pdf and is:

    \[F(x)=\int_{0}^x\left[\frac{1}{\mu} e^{-\frac{t}{\mu}}\right]dt=1-e^{-\frac{x}{\mu}}\nonumber\]

    Example \(\PageIndex{1}\)

    Let \(X\) = amount of time (in minutes) a postal clerk spends with a customer. The time is known from historical data to have an average amount of time equal to four minutes.

    It is given that \(\mu = 4\) minutes, that is, the average time the clerk spends with a customer is 4 minutes. Remember that we are still doing probability and thus we have to be told the population parameters such as the mean. To do any calculations, we need to know the mean of the distribution: the historical time to provide a service, for example. Knowing the historical mean allows the calculation of the decay parameter, \(\lambda\).

    \(\lambda=\frac{1}{\mu}\). Therefore, \(\lambda=\frac{1}{4}=0.25\).

    When the notation used the decay parameter, \(\lambda\), the probability density function is presented as \(f(x)=\lambda e^{-\lambda x}\), which is simply the original formula with \(\lambda\) substituted for \(\frac{1}{\mu}\), or \(f(x)=\frac{1}{\mu} e^{-\frac{1}{\mu} x}\).

    To calculate probabilities for an exponential probability density function, we need to use the cumulative density function. As shown below, the curve for the cumulative density function is:

    \(f(x) = 0.25e^{–0.25x}\) where \(x\) is at least zero and \(\lambda = 0.25\).

    For example, \(f(5) = 0.25e^{(-0.25)(5)} = 0.072\). In other words, the function has a value of .072 when \(x = 5\).

    The graph is as follows:

    Exponential graph with increments of 2 from 0-20 on the x-axis of μ = 4 and increments of 0.05 from 0.05-0.25 on the y-axis of m = 0.25. The curved line begins at the top at point (0, 0.25) and curves down to point (20, 0). The x-axis is equal to a continuous random variable.
    Figure \(\PageIndex{1}\)

    Notice the graph is a declining curve. When \(x = 0\),

    \(f(x) = 0.25e^{(−0.25)(0)} = (0.25)(1) = 0.25 = m\). The maximum value on the y-axis is always \(m\), one divided by the mean.

    Exercise \(\PageIndex{1}\)

    The amount of time spouses shop for anniversary cards can be modeled by an exponential distribution with the average amount of time equal to eight minutes. Write the distribution, state the probability density function, and graph the distribution.

    Example \(\PageIndex{2}\)

    a. Using the information in Example \(\PageIndex{1}\), find the probability that a clerk spends four to five minutes with a randomly selected customer.

    Answer

    a. Find \(P (4 < X < 5)\).
    The cumulative distribution function (CDF) gives the area to the left.
    \(P(X < x) = 1 – e^{–\lambda x}\)
    \(P(X < 5) = 1 – e^{(–0.25)(5)} = 0.7135\) and \(P(x < 4) = 1 – e^{(–0.25)(4)} = 0.6321\)
    \(P(4 < X < 5)= 0.7135 – 0.6321 = 0.0814\)

    Exponential graph with the curved line beginning at point (0, 0.25) and curves down towards point (∞, 0). Two vertical upward lines extend from points 4 and 5 to the curved line. The probability is in the area between points 4 and 5.
    Figure \(\PageIndex{2}\)
    Exercise \(\PageIndex{2}\)

    The number of days ahead travelers purchase their airline tickets can be modeled by an exponential distribution with the average amount of time equal to 15 days. Find the probability that a traveler will purchase a ticket fewer than ten days in advance. How many days do half of all travelers wait?

    Example \(\PageIndex{3}\)

    On the average, a certain computer part lasts ten years. The length of time the computer part lasts is exponentially distributed.

    a. What is the probability that a computer part lasts more than 7 years?

    Answer

    a. Let \(x =\) the amount of time (in years) a computer part lasts.
    \(\mu = 10\) so \(\lambda=\frac{1}{\mu}=\frac{1}{10}=0.1\)
    Find \(P(X > 7)\). Draw the graph.
    \(P(X > 7) = 1 – P(X < 7)\).
    Since \(P(X < x) = 1 – e^{–\lambda x}\) then \(P(X > x) = 1 – ( 1 –e^{–\lambda x}) = e^{–\lambda x}\)
    \(P(X > 7) = e^{(–0.1)(7)} = 0.4966\). The probability that a computer part lasts more than seven years is \(0.4966\).

    Exponential graph with the curved line beginning at point (0, 0.1) and curves down towards point (∞, 0). A vertical upward line extends from point 1 to the curved line. The probability area occurs from point 1 to the end of the curve. The x-axis is equal to the amount of time a computer part lasts.
    Figure \(\PageIndex{3}\)

    b. On the average, how long would five computer parts last if they are used one after another?

    Answer

    b. On the average, one computer part lasts ten years. Therefore, five computer parts, if they are used one right after the other would last, on the average, (5)(10) = 50 years.

    d. What is the probability that a computer part lasts between 9 and 11 years?

    Answer

    d. Find \(P (9 < X < 11)\). Draw the graph.

    Exponential graph with the curved line beginning at point (0, 0.1) and curves down towards point (∞, 0). Two vertical upward lines extend from point 9 and 11 to the curved line. The probability area occurs between point 9 and 11.
    Figure \(\PageIndex{4}\)

    \(P(9 < X < 11) = P(X < 11) – P(X < 9) = (1 – e^{(–0.1)(11)}) – (1 – e^{(–0.1)(9)}) = 0.6671 – 0.5934 = 0.0737\). The probability that a computer part lasts between 9 and 11 years is \(0.0737\).

    Exercise \(\PageIndex{3}\)

    On average, a pair of running shoes can last 18 months if used every day. The length of time running shoes last is exponentially distributed. What is the probability that a pair of running shoes last more than 15 months? On average, how long would six pairs of running shoes last if they are used one after the other? Eighty percent of running shoes last at most how long if used every day?

    Example \(\PageIndex{4}\)

    Suppose that the length of a phone call, in minutes, is an exponential random variable with decay parameter \(\frac{1}{12}\). If another person arrives at a public telephone just before you, find the probability that you will have to wait more than five minutes. Let X = the length of a phone call, in minutes.

    What is \(lambda, \mu\), and \(\sigma\)? The probability that you must wait more than 5 minutes is _______ .

    Answer

    \(\lambda = \frac{1}{12}\)

    \(\mu = 12\)

    \(\sigma = 12\)

    \(P(X > 5) = e^{-5/12} = 0.6592\)

    Example \(\PageIndex{5}\)

    The time spent waiting between events is often modeled using the exponential distribution. For example, suppose that an average of 30 customers per hour arrive at a store and the time between arrivals is exponentially distributed.

    1. On average, how many minutes elapse between two successive arrivals?
    2. When the store first opens, how long on average does it take for three customers to arrive?
    3. After a customer arrives, find the probability that it takes less than one minute for the next customer to arrive.
    4. After a customer arrives, find the probability that it takes more than five minutes for the next customer to arrive.
    5. Is an exponential distribution reasonable for this situation?
    Answer

    a.Since we expect 30 customers to arrive per hour (60 minutes), we expect on average one customer to arrive every two minutes on average.

    b.Since one customer arrives every two minutes on average, it will take six minutes on average for three customers to arrive.

    c.Let \(X =\) the time between arrivals, in minutes. By part a, \(\mu = 2\), so \(\lambda = \frac{1}{2}= 0.5\).
    The cumulative distribution function is \(P(X < x) = 1 – e^{(-0.5)(x)}\)
    Therefore \(P(X < 1) = 1 – e^{(–0.5)(1)} = 0.3935\).

    d4f9917dfb3468f3bc0ed9e719fde97fae5abf81
    Figure \(\PageIndex{5}\)
    d.\(P(X > 5) = 1 – P(X < 5) = 1 – (1 – e^{(-0.5)(5)}) = e^{–2.5} \approx 0.0821\).
    e52b2ba5cd06f475be8a11b308499332d3054bc2
    Figure \(\PageIndex{6}\)
    This model assumes that a single customer arrives at a time, which may not be reasonable since people might shop in groups, leading to several customers arriving at the same time. It also assumes that the flow of customers does not change throughout the day, which is not valid if some times of the day are busier than others.


    Memoryless Property of the Exponential Distribution

    Recall that the amount of time between customers for the postal clerk discussed earlier is exponentially distributed with a mean of two minutes. Suppose that five minutes have elapsed since the last customer arrived. Since an unusually long amount of time has now elapsed, it would seem to be more likely for a customer to arrive within the next minute. With the exponential distribution, this is not the case–the additional time spent waiting for the next customer does not depend on how much time has already elapsed since the last customer. This is referred to as the memoryless property. The exponential and geometric probability density functions are the only probability functions that have the memoryless property. Specifically, the memoryless property says that

    \(P(X > r + t | X > r) = P (X > t)\) for all \(r \geq 0\) and \(t \geq 0\)

    For example, if five minutes have elapsed since the last customer arrived, then the probability that more than one minute will elapse before the next customer arrives is computed by using r = 5 and t = 1 in the foregoing equation.

    \(P(X > 5 + 1 | X > 5) = P(X > 1) = e^{(-0.5)(1)} = 0.6065\).

    This is the same probability as that of waiting more than one minute for a customer to arrive after the previous arrival.

    The exponential distribution is often used to model the longevity of an electrical or mechanical device. In Example \(\PageIndex{3}\), the lifetime of a certain computer part has the exponential distribution with a mean of ten years. The memoryless property says that knowledge of what has occurred in the past has no effect on future probabilities. In this case it means that an old part is not any more likely to break down at any particular time than a brand new part. In other words, the part stays as good as new until it suddenly breaks. For example, if the part has already lasted ten years, then the probability that it lasts another seven years is \(P(X > 17|X > 10) = P(X > 7) = 0.4966\), where the vertical line is read as "given".

    Example \(\PageIndex{6}\)

    Refer back to the postal clerk again where the time a postal clerk spends with his or her customer has an exponential distribution with a mean of four minutes. Suppose a customer has spent four minutes with a postal clerk. What is the probability that he or she will spend at least an additional three minutes with the postal clerk?

    The decay parameter of \(X\) is \(\lambda = \frac{1}{4} = 0.25\).

    The cumulative distribution function is \(P(X < x) = 1 – e^{–0.25x}\).

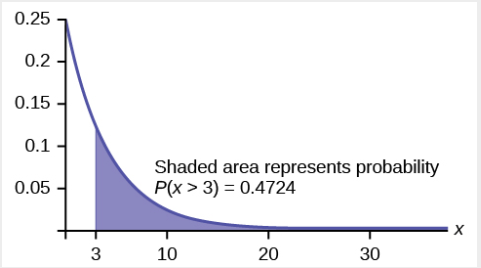
    We want to find \(P (X > 7|X > 4)\). The memoryless property says that \(P (X > 7|X > 4) = P (X > 3)\), so we just need to find the probability that a customer spends more than three minutes with a postal clerk.

    This is \(P(X > 3) = 1 – P(X < 3) = 1 – (1 – e^{–0.25⋅3}) = e^{–0.75} \approx 0.4724\).

    clipboard_e0ee6b647c2e9dde9fddd426aab75c01d.png
    Figure \(\PageIndex{7}\)

    Relationship between the Poisson and the Exponential Distribution

    There is an interesting relationship between the exponential distribution and the Poisson distribution. Suppose that the time that elapses between two successive events follows the exponential distribution with a mean of \(\mu\) units of time. Also assume that these times are independent, meaning that the time between events is not affected by the times between previous events. If these assumptions hold, then the number of events per unit time follows a Poisson distribution with mean \(\mu\). Recall that if \(X\) has the Poisson distribution with mean \(\mu\), then \(P(X=x)=\frac{\mu^{x_{e}-\mu}}{x !}\).

    The formula for the exponential distribution: \(P(X=x)=m e^{-m x}=\frac{1}{\mu} e^{-\frac{1}{\mu} x}\) Where \(m =\) the rate parameter, or \(\mu =\) average time between occurrences.

    We see that the exponential is the cousin of the Poisson distribution and they are linked through this formula. There are important differences that make each distribution relevant for different types of probability problems.

    First, the Poisson has a discrete random variable, \(X\), where time; a continuous variable is artificially broken into discrete pieces. We saw that the number of occurrences of an event in a given time interval, \(X\), follows the Poisson distribution.

    For example, the number of times the telephone rings per hour. By contrast, the time between occurrences follows the exponential distribution. For example. The telephone just rang, how long will it be until it rings again? We are measuring length of time of the interval, a continuous random variable, exponential, not events during an interval, Poisson.

    The Exponential Distribution v. the Poisson Distribution

    A visual way to show both the similarities and differences between these two distributions is with a time line.

    e0b0e07dc9099a6307c6ca84d99b004815673dcc
    Figure \(\PageIndex{8}\)

    The random variable for the Poisson distribution is discrete and thus counts events during a given time period, \(t_1\) to \(t_2\) on Figure \(\PageIndex{8}\), and calculates the probability of that number occurring. The number of events, four in the graph, is measured in counting numbers; therefore, the random variable of the Poisson is a discrete random variable.

    The exponential probability distribution calculates probabilities of the passage of time, a continuous random variable. In Figure \(\PageIndex{8}\) this is shown as the bracket from t1 to the next occurrence of the event marked with a triangle.

    Classic Poisson distribution questions are "how many people will arrive at my checkout window in the next hour?".

    Classic exponential distribution questions are "how long it will be until the next person arrives," or a variant, "how long will the person remain here once they have arrived?".

    Again, the formula for the exponential distribution is:

    \[f(x)=\lambda e^{-\lambda x} \operatorname{or} f(x)=\frac{1}{\mu} e^{-\frac{1}{\mu} x}\nonumber\]

    We see immediately the similarity between the exponential formula and the Poisson formula.

    \[P(x)=\frac{\mu^{x} e^{-\mu}}{x !}\nonumber\]

    Both probability density functions are based upon the relationship between time and exponential growth or decay. The “e” in the formula is a constant with the approximate value of 2.71828 and is the base of the natural logarithmic exponential growth formula. When people say that something has grown exponentially this is what they are talking about.

    An example of the exponential and the Poisson will make clear the differences been the two. It will also show the interesting applications they have.

    Poisson Distribution

    Suppose that historically 10 customers arrive at the checkout lines each hour. Remember that this is still probability so we have to be told these historical values. We see this is a Poisson probability problem.

    We can put this information into the Poisson probability density function and get a general formula that will calculate the probability of any specific number of customers arriving in the next hour.

    The formula is for any value of the random variable we chose, and so the x is put into the formula. This is the formula:

    \[f(x)=\frac{10^{x} e^{-10}}{x !}\nonumber\]

    As an example, the probability of 15 people arriving at the checkout counter in the next hour would be

    \[P(x=15)=\frac{10^{15} e^{-10}}{15 !}=0.0611\nonumber\]

    Here we have inserted x = 15 and calculated the probability that in the next hour 15 people will arrive is .061.

    Exponential Distribution

    If we keep the same historical facts that 10 customers arrive each hour, but we now are interested in the service time a person spends at the counter, then we would use the exponential distribution. The exponential probability function for any value of x, the random variable, for this particular checkout counter historical data is:

    \[f(x)=\frac{1}{.1} e^{-x / 1}=10 e^{-10 x}\nonumber\]

    To calculate \(\mu\), the historical average service time, we simply divide the number of people that arrive per hour, 10 , into the time period, one hour, and have \(\mu = 0.1\). Historically, people spend 0.1 of an hour at the checkout counter, or 6 minutes. This explains the .1 in the formula.

    There is a natural confusion with \(\mu\) in both the Poisson and exponential formulas. They have different meanings, although they have the same symbol. The mean of the exponential is one divided by the mean of the Poisson. If you are given the historical number of arrivals you have the mean of the Poisson. If you are given an historical length of time between events you have the mean of an exponential.

    Continuing with our example at the checkout clerk; if we wanted to know the probability that a person would spend 9 minutes or less checking out, then we use this formula. First, we convert to the same time units which are parts of one hour. Nine minutes is 0.15 of one hour. Next we note that we are asking for a range of values. This is always the case for a continuous random variable. We write the probability question as:

    \[p(x \leq 9)=1-10 e^{-10 x}\nonumber\]

    We can now put the numbers into the formula and we have our result.

    \[p(x=.15)=1-10 e^{-10(.15)}=0.7769\nonumber\]

    The probability that a customer will spend 9 minutes or less checking out is \(0.7769\).

    We see that we have a high probability of getting out in less than nine minutes and a tiny probability of having 15 customers arriving in the next hour.


    This page titled 5.4: The Exponential Distribution is shared under a CC BY 4.0 license and was authored, remixed, and/or curated by OpenStax.