
20.32: Educational Attainment and Racial, Ethnic, and Gender Disparity
- Page ID
- 36279

\( \newcommand{\vecs}[1]{\overset { \scriptstyle \rightharpoonup} {\mathbf{#1}} } \)
\( \newcommand{\vecd}[1]{\overset{-\!-\!\rightharpoonup}{\vphantom{a}\smash {#1}}} \)
\( \newcommand{\id}{\mathrm{id}}\) \( \newcommand{\Span}{\mathrm{span}}\)
( \newcommand{\kernel}{\mathrm{null}\,}\) \( \newcommand{\range}{\mathrm{range}\,}\)
\( \newcommand{\RealPart}{\mathrm{Re}}\) \( \newcommand{\ImaginaryPart}{\mathrm{Im}}\)
\( \newcommand{\Argument}{\mathrm{Arg}}\) \( \newcommand{\norm}[1]{\| #1 \|}\)
\( \newcommand{\inner}[2]{\langle #1, #2 \rangle}\)
\( \newcommand{\Span}{\mathrm{span}}\)
\( \newcommand{\id}{\mathrm{id}}\)
\( \newcommand{\Span}{\mathrm{span}}\)
\( \newcommand{\kernel}{\mathrm{null}\,}\)
\( \newcommand{\range}{\mathrm{range}\,}\)
\( \newcommand{\RealPart}{\mathrm{Re}}\)
\( \newcommand{\ImaginaryPart}{\mathrm{Im}}\)
\( \newcommand{\Argument}{\mathrm{Arg}}\)
\( \newcommand{\norm}[1]{\| #1 \|}\)
\( \newcommand{\inner}[2]{\langle #1, #2 \rangle}\)
\( \newcommand{\Span}{\mathrm{span}}\) \( \newcommand{\AA}{\unicode[.8,0]{x212B}}\)
\( \newcommand{\vectorA}[1]{\vec{#1}} % arrow\)
\( \newcommand{\vectorAt}[1]{\vec{\text{#1}}} % arrow\)
\( \newcommand{\vectorB}[1]{\overset { \scriptstyle \rightharpoonup} {\mathbf{#1}} } \)
\( \newcommand{\vectorC}[1]{\textbf{#1}} \)
\( \newcommand{\vectorD}[1]{\overrightarrow{#1}} \)
\( \newcommand{\vectorDt}[1]{\overrightarrow{\text{#1}}} \)
\( \newcommand{\vectE}[1]{\overset{-\!-\!\rightharpoonup}{\vphantom{a}\smash{\mathbf {#1}}}} \)
\( \newcommand{\vecs}[1]{\overset { \scriptstyle \rightharpoonup} {\mathbf{#1}} } \)
\( \newcommand{\vecd}[1]{\overset{-\!-\!\rightharpoonup}{\vphantom{a}\smash {#1}}} \)
\(\newcommand{\avec}{\mathbf a}\) \(\newcommand{\bvec}{\mathbf b}\) \(\newcommand{\cvec}{\mathbf c}\) \(\newcommand{\dvec}{\mathbf d}\) \(\newcommand{\dtil}{\widetilde{\mathbf d}}\) \(\newcommand{\evec}{\mathbf e}\) \(\newcommand{\fvec}{\mathbf f}\) \(\newcommand{\nvec}{\mathbf n}\) \(\newcommand{\pvec}{\mathbf p}\) \(\newcommand{\qvec}{\mathbf q}\) \(\newcommand{\svec}{\mathbf s}\) \(\newcommand{\tvec}{\mathbf t}\) \(\newcommand{\uvec}{\mathbf u}\) \(\newcommand{\vvec}{\mathbf v}\) \(\newcommand{\wvec}{\mathbf w}\) \(\newcommand{\xvec}{\mathbf x}\) \(\newcommand{\yvec}{\mathbf y}\) \(\newcommand{\zvec}{\mathbf z}\) \(\newcommand{\rvec}{\mathbf r}\) \(\newcommand{\mvec}{\mathbf m}\) \(\newcommand{\zerovec}{\mathbf 0}\) \(\newcommand{\onevec}{\mathbf 1}\) \(\newcommand{\real}{\mathbb R}\) \(\newcommand{\twovec}[2]{\left[\begin{array}{r}#1 \\ #2 \end{array}\right]}\) \(\newcommand{\ctwovec}[2]{\left[\begin{array}{c}#1 \\ #2 \end{array}\right]}\) \(\newcommand{\threevec}[3]{\left[\begin{array}{r}#1 \\ #2 \\ #3 \end{array}\right]}\) \(\newcommand{\cthreevec}[3]{\left[\begin{array}{c}#1 \\ #2 \\ #3 \end{array}\right]}\) \(\newcommand{\fourvec}[4]{\left[\begin{array}{r}#1 \\ #2 \\ #3 \\ #4 \end{array}\right]}\) \(\newcommand{\cfourvec}[4]{\left[\begin{array}{c}#1 \\ #2 \\ #3 \\ #4 \end{array}\right]}\) \(\newcommand{\fivevec}[5]{\left[\begin{array}{r}#1 \\ #2 \\ #3 \\ #4 \\ #5 \\ \end{array}\right]}\) \(\newcommand{\cfivevec}[5]{\left[\begin{array}{c}#1 \\ #2 \\ #3 \\ #4 \\ #5 \\ \end{array}\right]}\) \(\newcommand{\mattwo}[4]{\left[\begin{array}{rr}#1 \amp #2 \\ #3 \amp #4 \\ \end{array}\right]}\) \(\newcommand{\laspan}[1]{\text{Span}\{#1\}}\) \(\newcommand{\bcal}{\cal B}\) \(\newcommand{\ccal}{\cal C}\) \(\newcommand{\scal}{\cal S}\) \(\newcommand{\wcal}{\cal W}\) \(\newcommand{\ecal}{\cal E}\) \(\newcommand{\coords}[2]{\left\{#1\right\}_{#2}}\) \(\newcommand{\gray}[1]{\color{gray}{#1}}\) \(\newcommand{\lgray}[1]{\color{lightgray}{#1}}\) \(\newcommand{\rank}{\operatorname{rank}}\) \(\newcommand{\row}{\text{Row}}\) \(\newcommand{\col}{\text{Col}}\) \(\renewcommand{\row}{\text{Row}}\) \(\newcommand{\nul}{\text{Nul}}\) \(\newcommand{\var}{\text{Var}}\) \(\newcommand{\corr}{\text{corr}}\) \(\newcommand{\len}[1]{\left|#1\right|}\) \(\newcommand{\bbar}{\overline{\bvec}}\) \(\newcommand{\bhat}{\widehat{\bvec}}\) \(\newcommand{\bperp}{\bvec^\perp}\) \(\newcommand{\xhat}{\widehat{\xvec}}\) \(\newcommand{\vhat}{\widehat{\vvec}}\) \(\newcommand{\uhat}{\widehat{\uvec}}\) \(\newcommand{\what}{\widehat{\wvec}}\) \(\newcommand{\Sighat}{\widehat{\Sigma}}\) \(\newcommand{\lt}{<}\) \(\newcommand{\gt}{>}\) \(\newcommand{\amp}{&}\) \(\definecolor{fillinmathshade}{gray}{0.9}\)Learning Objectives
- To study large disparities in educational attainment among various racial and ethnic groups
Research conducted by
United States Census Bureau
Case study prepared by
Robert F. Houser, Georgette Baghdady, and Jennifer E. Konick
Overview
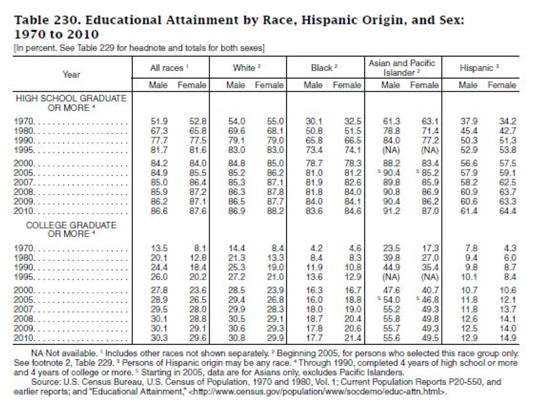
The U.S. Census Bureau defines educational attainment as the highest level of education that a person has completed. Large disparities in educational attainment continue to exist among racial and ethnic groups. The gender gap in educational attainment, however, has been undergoing a dramatic social shift in recent decades. In Table \(\PageIndex{1}\) below, the U.S. Census Bureau tabulated these trends among Whites, Blacks, Asians and Pacific Islanders, and Hispanics between \(1970\) and \(2010\). This case study focuses only on college graduates. The data for "College graduate or more" represent the percentage of adults aged \(25\) years and older that obtained a degree from regular four-year colleges and universities and graduate or professional schools in each racial and ethnic group.
The U.S. Census Bureau defines the racial and ethnic categories in the following manner:
- “White” refers to persons having origins in any of the original peoples of Europe, the Middle East, or North Africa.
- “Black” refers to persons having origins in any of the Black racial groups of Africa.
- “Asian” refers to persons having origins in any of the original peoples of the Far East, Southeast Asia, or the Indian subcontinent.
- “Pacific Islander” refers to persons having origins in any of the original peoples of the Pacific Islands, such as Hawaii, Guam, Samoa, and Tonga.
- “Hispanic” refers to an ethnic group comprised of persons of any race who are of Cuban, Mexican, Puerto Rican, South or Central American, or other Spanish culture or origin.
Educational attainment is strongly associated with future employment, income, and health status.
Questions to Answer
How has the percentage of college graduates changed over time between \(1970\) and \(2010\) among the racial and ethnic groups and between the genders within each group? How might we illustrate these changes graphically?
Design Issues
Beginning with the \(2000\) U.S. Census, respondents were given the option of selecting more than one race category to indicate their racial identities. Therefore, data on race from \(2000\) and beyond are not directly comparable with earlier censuses. The data in Table \(\PageIndex{1}\) represent persons who selected only one race category and exclude persons who selected more than one race.
In the \(2005\) U.S. Census and beyond, the “Asian and Pacific Islander” category was split into two separate categories, “Asian” and “Native Hawaiian or Other Pacific Islander.” There were several reasons for the split. The combined category was not a homogeneous group because it put together peoples with few social or cultural similarities and who are dissimilar on important demographic characteristics. For example, in \(1990\), about \(11\) percent of Pacific Islanders aged \(25\) years and older obtained a bachelor’s degree compared with about \(40\) percent of Asians. Since Pacific Islanders are numerically a smaller group than Asians (in \(2010\), there were about a half million Pacific Islanders versus about \(14.6\) million Asians), not including them in the data of Table \(\PageIndex{1}\) starting in \(2005\) biases the percentage of college graduates upwards somewhat, but not strongly.
Descriptions of Variables
| Variable | Description |
| College graduate or more | Obtained a degree from regular four-year colleges and universities and graduate or professional schools |
| Year | Decade years from 1970 to 2010 |
| White_M White_F |
Percentage of college graduates in U.S. subpopulation of White males aged 25 years and over; likewise for White females |
| Black_M Black_F |
Percentage of college graduates in U.S. subpopulation of Black males aged 25 years and over; likewise for Black females |
| AsnPac_M AsnPac_F |
Percentage of college graduates in U.S. subpopulation of Asian and Pacific Islander males aged 25 years and over; likewise for Asian and Pacific Islander females |
| Hispan_M Hispan_F |
Percentage of college graduates in U.S. subpopulation of Hispanic males aged 25 years and over; likewise for Hispanic females |
Data Files
Educational_attainment.xls
Links
Overview of Race and Hispanic Origin: 2010
Latinos and Education: Explaining the Attainment Gap
Why Do Women Outnumber Men in College?
References
- U.S. Census Bureau, Statistical Abstract of the United States: 2012. Section 4. Education, 143-151
- Telfair, J., Shelton, T. L. (2012). Educational attainment as a social determinant of health. North Carolina Medical Journal, 73(5), 358-365