
2.1: Statistical Power
- Page ID
- 27670

We’ve seen that it’s possible to miss a real effect simply by not taking enough data. In most cases, this is a problem: we might miss a viable medicine or fail to notice an important side-effect. How do we know how much data to collect?
Statisticians provide the answer in the form of “statistical power.” The power of a study is the likelihood that it will distinguish an effect of a certain size from pure luck. A study might easily detect a huge benefit from a medication, but detecting a subtle difference is much less likely. Let’s try a simple example.
Suppose a gambler is convinced that an opponent has an unfair coin: rather than getting heads half the time and tails half the time, the proportion is different, and the opponent is using this to cheat at incredibly boring coin-flipping games. How to prove it?
You can’t just flip the coin a hundred times and count the heads. Even with a perfectly fair coin, you don’t always get fifty heads:
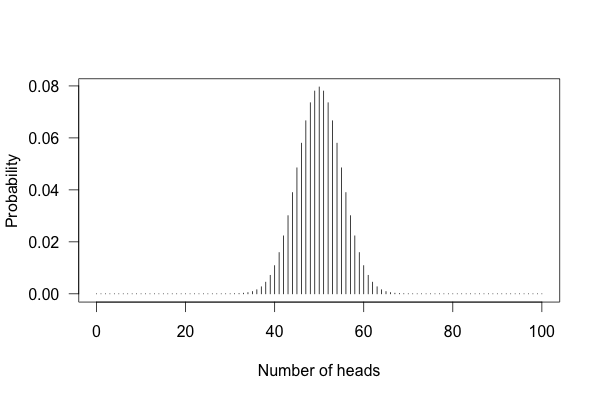
You can see that \(50\) heads is the most likely option, but it’s also reasonably likely to get \(45\) or \(57\). So if you get \(57\) heads, the coin might be rigged, but you might just be lucky.
Let’s work out the math. Let’s say we look for a \(p\) value of \(0.05\) or less, as scientists typically do. That is, if I count up the number of heads after \(10\) or \(100\) trials and find a deviation from what I’d expect – half heads, half tails – I call the coin unfair if there’s only a \(5\)% chance of getting a deviation that size or larger with a fair coin. Otherwise, I can conclude nothing: the coin may be fair, or it may be only a little unfair. I can’t tell.
So, what happens if I flip a coin ten times and apply these criteria?
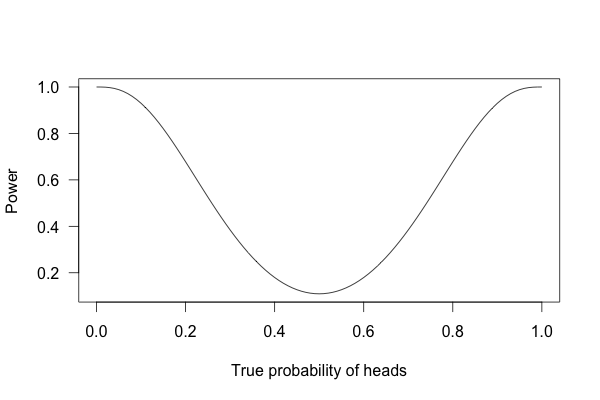
This is called a power curve. Along the horizontal axis, we have the different possibilities for the coin’s true probability of getting heads, corresponding to different levels of unfairness. On the vertical axis is the probability that I will conclude the coin is rigged after ten tosses, based on the \(p\) value of the result.
You can see that if the coin is rigged to give heads \(60\)% of the time, and I flip the coin \(10\) times, I only have a \(20\)% chance of concluding that it’s rigged. There’s just too little data to separate rigging from random variation. The coin would have to be incredibly biased for me to always notice.
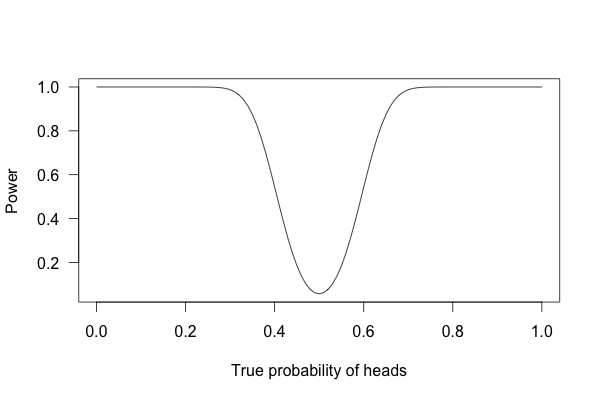
But what if I flip the coin \(100\) times?
Or \(1,000\) times?
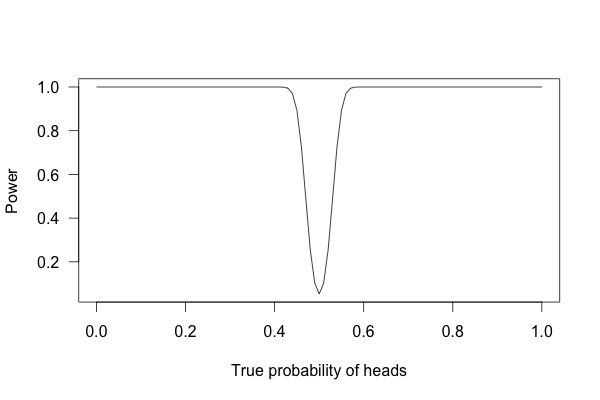
With one thousand flips, I can easily tell if the coin is rigged to give heads \(60\)% of the time. It’s just overwhelmingly unlikely that I could flip a fair coin \(1,000\) times and get more than \(600\) heads.