
10.5: Chapter 10 Exercises
- Page ID
- 24069

1. The shape of the \(\chi^{2}\) -distribution is usually:
a) Normal
b) Bell-shaped
c) Skewed left
d) Skewed right
e) Uniform
2. Why are Goodness of Fit tests always right-tailed?
a) Because the test checks for a large variance between observed and expected values.
b) Because the \(\chi^{2}\)-distribution is skewed right.
c) Because \(\chi^{2}\) values can never be negative.
d) Because they test a variance and variance is always positive.
3. What are the requirements to be satisfied before using a Goodness of Fit test? Check all that apply.
a) The data are obtained using systematic sampling.
b) The data are obtained from a simple random sample.
c) The expected frequency from each category is 5 or more.
d) The observed frequency from each category is organized from largest to smallest.
e) The degrees of freedom are less than 30.
For exercises 4-19, show all 5 steps for hypothesis testing:
a) State the hypotheses.
b) Compute the test statistic.
c) Compute the critical value or p-value.
d) State the decision.
e) Write a summary.
4. Pamplona, Spain, is the home of the festival of San Fermin – The Running of the Bulls. The town is in festival mode for a week and a half every year at the beginning of July. There is a running joke in the city that Pamplona has a baby boom every April – 9 months after San Fermin. To test this claim, a resident takes a random sample of 200 birthdays from native residents and finds the following. At the 0.05 level of significance, can it be concluded that births in Pamplona are not equally distributed throughout the 12 months of the year?

5. A professor using an open-source introductory statistics book predicts that 60% of the students will purchase a hard copy of the book, 25% will print it out from the web, and 15% will read it online. At the end of the term she asks her students to complete a survey where they indicate what format of the book they used. Of the 126 students, 45 said they bought a hard copy of the book, 25 said they printed it out from the web, and 56 said they read it online. Run a Goodness of Fit test at \(\alpha\) = 0.05 to see if the distribution is different than expected.
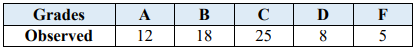
6. The proportion of final grades for an anatomy class for the whole department are distributed as 10% A's, 23% B's, 45% C's, 14% D's, and 8% F's. A department chair is getting quite a few student complaints about a particular professor. The department chair wants to check to see if the professor’s students’ grades have a different distribution compared to the rest of the department. At the end of the term, the students have the following grades. Use \(\alpha\) = 0.05.
7. You might think that if you looked at the first digit in randomly selected numbers that the distribution would be uniform. Actually, it is not! Simon Newcomb and later Frank Benford both discovered that the digits occur according to the following distribution.

A forensic accountant can use Benford's Law to detect fraudulent tax data. Suppose you work for the IRS and are investigating an individual suspected of embezzling. The first digit of 192 checks to a supposed company are as follows.

Run a complete Goodness of Fit test to see if the individual is likely to have committed tax fraud. Use \(\alpha\) = 0.05. Should law enforcement officials pursue the case? Explain.
8. A college professor is curious if location of seat in class affects grade in the class. She is teaching in a lecture hall to 200 students. The lecture hall has 10 rows, so she splits it into 5 categories – Rows 1-2, Rows 3-4, Rows 5-6, Rows 7-8, and Rows 9-10. At the end of the course, she determines the top 25% of grades in the class, and if location of seat makes no difference, she would expect that these top 25% of students would be equally dispersed throughout the classroom. Her observations are recorded below. Run a Goodness of Fit test to determine whether location has an impact on grade. Let \(\alpha\) = 0.05.

9. Consumer panel preferences for four store displays follow. Test to see whether there is a preference among the four display designs. Use \(\alpha\) = 0.05.

10. The manager of a coffee shop wants to know if his customers’ drink preferences have changed in the past year. He knows that last year the preferences followed the following proportions – 34% Americano, 21% Cappuccino, 14% Espresso, 11% Latte, 10% Macchiato, 10% Other. In a random sample of 300 customers, he finds that 90 ordered Americanos, 65 ordered Cappuccinos, 52 ordered Espressos, 35 ordered Lattes, 34 ordered Macchiatos, and the rest ordered something in the Other category. Run a Goodness of Fit test to determine whether drink preferences have changed at his coffee shop. Use a 0.05 level of significance.
11. The director of a Driver’s Ed program is curious if the time of year has an impact on number of car accidents in the United States. They assume that weather may have a significant impact on the ability of drivers to control their vehicles. They take a random sample of 100 car accidents and record the season each occurred in. They found that 20 occurred in the spring, 31 in the summer, 23 in the fall, and 26 in the winter. Can it be concluded at the 0.05 level of significance that car accidents are not equally distributed throughout the year?
12. A college prep school advertises that their students are more prepared to succeed in college than other schools. To show this, they categorize GPAs into 4 groups and look up the proportion of students at a state college in each category. They find that 7% have a 0-0.99, 21% have a 1-1.99, 37% have a 2-2.99, and 35% have a 3-4.00 in GPA. They then take a random sample of 150 of their graduates at the state college and find that 5 graduates have a 0- 0.99, 18 have a 1-1.99, 67 have a 2-2.99, and 60 have a 3-4.00. Can they conclude that the grades of their graduates are distributed differently than the general population at the school? Test at the 0.05 level of significance.
13. The permanent residence of adults aged 18-25 in the United States was examined in a survey from the year 2000. The survey revealed that 27% of these adults lived alone, 32% lived with a roommate(s), and 41% lived with their parents/guardians. In 2008, during an economic recession in the country, another such survey of 1,500 people revealed that 378 lived alone, 452 lived with a roommate(s), and 670 lived with their parents. Is there a significant difference in where young adults lived in 2000 versus 2008? Test with a Goodness of Fit test at \(\alpha\) = 0.05.
14. A color code personality test categorizes people into four colors – Red (Power), Blue (Intimacy), Green (Peace), and Yellow (Fun). In general, 25% of people are Red, 35% Blue, 20% Green, and 20% Yellow. An art class of 33 students is tested at a university and 4 are found to be Red, 14 Blue, 7 Green, and 8 Yellow. Can it be concluded that personality type has an impact on students’ areas of interest and talents, such as artistic students? Test at a 0.05 level of significance.
15. An urban economist is curious if the distribution in where Oregon residents live is different today than it was in 1990. She observes that today there are approximately 3,050 thousand residents in NW Oregon, 907 thousand residents in SW Oregon, 257 thousand in Central Oregon, and 106 thousand in Eastern Oregon. She knows that in 1990 the breakdown was as follows: 72.7% NW Oregon, 19.7% SW Oregon, 4.8% Central Oregon, and 2.8% Eastern Oregon. Can she conclude that the distribution in residence is different today at a 0.05 level of significance?
16. A large department store is curious what sections of the store make the most sales. The manager has data from 10 years prior that show 30% of sales come from Clothing, 25% Home Appliances, 18% Housewares, 13% Cosmetics, 12% Jewelry, and 2% Other. In a random sample of 500 current sales, 176 came from Clothing, 150 from Home Appliances, 75 from Housewares, 42 from Cosmetics, 51 from Jewelry, and 6 from Other. At \(\alpha\) = 0.10, can the manager conclude that the distribution of sales among the departments has changed?
17. Students at a high school are asked to evaluate their experience in a class at the end of each school year. The courses are evaluated on a 1-4 scale – with 4 being the best experience possible. In the History Department, the courses typically are evaluated at 10% 1’s, 15% 2’s, 34% 3’s, and 41% 4’s. A new history teacher, Mr. Mendoza, sets a goal to outscore these numbers. At the end of the year, he takes a random sample of his evaluations and finds 11 1’s, 14 2’s, 47 3’s, and 53 4’s. At the 0.05 level of significance, can Mr. Mendoza claim that his evaluations are significantly different from the History Department’s?
18. A company manager believes that a person’s ability to be a leader is directly related to their zodiac sign. He never selects someone to chair a committee without first evaluating their zodiac sign. An irate employee sets out to show her manager is wrong. She claims that if zodiac sign truly makes a difference in leadership, then a random sample of 200 CEOs in our country would reveal a difference in zodiac sign distribution. She finds the following zodiac signs for her random sample of 200 CEOs. Can the employee conclude that there is a difference in the proportion of CEOs for the twelve zodiac signs? Use \(\alpha\) = 0.05.

19. A company that develops over-the-counter medicines is working on a new product that is meant to shorten the length of time that sore throats persist. To test their product for effectiveness, they take a random sample of 100 people and record how long it took for their symptoms to completely disappear. The results are in the table below. The company knows that on average (without medication) it takes a sore throat 6 days or less to heal 42% of the time, 7-9 days 31% of the time, 10-12 days 16% of the time, and 13 days or more 11% of the time. Can it be concluded at the 0.01 level of significance that the patients who took the medicine healed at a different rate than these percentages?

20. What are the requirements to be satisfied before using the \(\chi^{2}\) Independence Test? Check all that apply.
a) The sample sizes must be greater than 30.
b) The data are obtained from a random sample.
c) The data are obtained using stratified sampling.
d) The expected frequency from each category is 5 or more.
e) The observed frequency from each category is organized from largest to smallest.
f) The population is normally distributed.
21. The null hypothesis for the \(\chi^{2}\) Independence Test always states that _____________________________.
a) the two values are equal.
b) one variable is dependent on another variable.
c) one variable is independent of another variable.
d) the expected values and observed values are the same.
22. What are the degrees of freedom used in the \(\chi^{2}\) Independence Test?
a) \(n - 1\)
b) \(\text{Rows} + \text{Columns}\)
c) \(n\)
d) \((\text{Rows} - 1) \times (\text{Columns} - 1)\)
e) \(n - 2\)
For exercises 23-33, show all 5 steps for hypothesis testing:
a) State the hypotheses.
b) Compute the test statistic.
c) Compute the critical value or p-value.
d) State the decision.
e) Write a summary.
23. A manufacturing company knows that their machines produce parts that are defective on occasion. They have 4 machines producing parts and want to test if defective parts are dependent on the machine that produced it. They take a random sample of 300 parts and find the following results. Test at the 0.05 level of significance.

24. The sample data below show the number of companies providing health insurance for small, medium and large companies. Test to see whether health insurance coverage and company size are dependent. Use \(\alpha\) = 0.01.

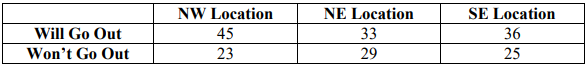
25. A restaurant chain that has 3 locations in Portland is trying to determine which of their 3 locations they should keep open on New Year’s Eve. They survey a random sample of customers at each location and ask each whether they plan to go out to eat on New Year’s Eve. The results are below. Run a test for independence to decide if the proportion of customers who will go out to eat on New Year’s Eve is dependent on location. Use \(\alpha\) = 0.05.
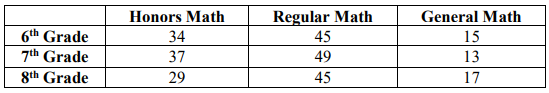
26. The following sample was collected during registration at a large middle school. At the 0.05 level of significance, can it be concluded that level of math is dependent on grade level?
27. A high school offers math placement exams for incoming freshmen to place students into the appropriate math class during their freshman year. Three middle schools were sampled and the following pass/fail results were found. Test to see if the math placement exam result and the school that students attend are dependent at the 0.10 level of significance.

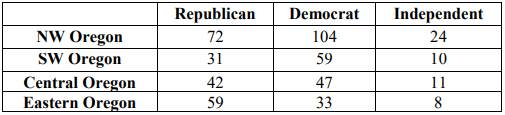
28. A public opinion poll surveyed a simple random sample of 500 voters in Oregon. The respondents were asked which political party they identified with most and were categorized by residence. Results are shown below. Decide if voting preference is dependent on location of residence. Let \(\alpha\) = 0.05.
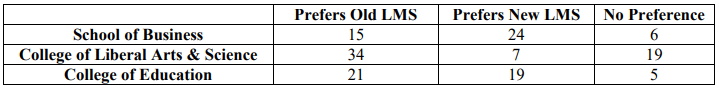
29. A university changed to a new learning management system (LMS) during the past school year. The school wants to find out how it is working for the different departments – the results in preference found from a survey are below. Test to see if the department and LMS preference are dependent at \(\alpha\) = 0.05.
30. The medal count for the 2018 winter Olympics is recorded below. Run an independence test to find out if the medal won is dependent on country. Use \(\alpha\) = 0.10.

31. An electronics store has 4 branches in a large city. They are curious if sales in any particular department are different depending on location. They take a random sample of purchases throughout the 4 branches – the results are recorded below. Test to see if the type of electronic device and store branch are dependent at the 0.05 level of significance.

32. A high school runs a survey asking students if they participate in sports. The results are found below. Test to see if there is a relationship between participating in sports and year in school at \(\alpha\) = 0.05.

33. A 4-year college is curious which of their students hold down a job while also attending school. They poll the students and find the results below. Test to see if there is a relationship between college students having a job and year in school. Use \(\alpha\) = 0.05.

- Answers to Odd Numbered Exercises
-
1) d
3) b & c
5) \(H_{0}: p_{1} = 0.6, p_{2} = 0.25, p_{3} = 0.15\); \(H_{1}:\) At least one proportion is different. \(\chi^{2} = 86.5529\); p-value \(=1.604 \times 10^{-19} = 0\); reject \(H_{0}\). There is enough evidence to support the claim that the distribution is different than expected. There were more students than expected that would read the text online.
7) \(H_{0}: p_{1} = 0.301, p_{2} = 0.176, p_{3} = 0.125, p_{4} = 0.097, p_{5} = 0.079, p_{6} = 0.067, p_{7} = 0.058, p_{8} = 0.051, p_{9} = 0.046\); \(H_{1}:\) At least one proportion is different. \(\chi^{2}\) =11.8466; CV = 15.5073; do not reject \(H_{0}\). There is no evidence of tax fraud so law enforcement officials should not pursue the case.
9) \(H_{0}: p_{1} = 0.25, p_{2} = 0.25, p_{3} = 0.25, p_{4} = 0.25\); \(H_{1}:\) At least one proportion is different. \(\chi^{2}\) = 3.16; p-value = 0.3676; do not eject \(H_{0}\). There is not enough evidence to support the claim that preference among the four display designs.
11) \(H_{0}: p_{1} = 0.25, p_{2} = 0.25, p_{3} = 0.25, p_{4} = 0.25\); \(H_{1}:\) At least one proportion is different. \(\chi^{2}\) = 2.64; p-value = 0.4505; do not reject \(H_{0}\). There is not enough evidence to support the claim that car accidents are not equally distributed throughout the year.
13) \(H_{0}: p_{1} = 0.27, p_{2} = 0.32, p_{3} = 0.41\); \(H_{1}:\) At least one proportion is different. \(\chi^{2}\) = 8.352; p-value = 0.0154; reject \(H_{0}\). There is enough evidence to support the claim that there a significant difference in where young adults lived in 2000 versus 2008. There are fewer young adults living at home than expected.
15) \(H_{0}: p_{1} = 0.727, p_{2} = 0.197, p_{3} = 0.048, p_{4} = 0.028\); \(H_{1}:\) At least one proportion is different. \(\chi^{2}\) = 20.0291; p-value = 0.0002; reject H0. There is enough evidence to support the claim that the distribution of Oregon residents is different now compared to 1990. There were more Oregonians in central Oregon than expected.
17) \(H_{0}: p_{1} = 0.1, p_{2} = 0.15, p_{3} = 0.34, p_{4} = 0.4\); \(H_{1}:\) At least one proportion is different. \(\chi^{2}\) = 1.9196; p-value = 0.5893; do not reject \(H_{0}\). There is not enough evidence to support the claim that the Mr. Mendoza’s course evaluation scores are different compared to the rest of the History Department’s evaluations.
19) \(H_{0}: p_{1} = 0.42, p_{2} = 0.31, p_{3} = 0.16, p_{4} = 0.11\); \(H_{1}:\) At least one proportion is different. \(\chi^{2}\) = 7.6986; p-value = 0.05267; do not reject H0. There is not enough evidence to support the claim that the patients who took the medicine healed at a different rate than these percentages.
21) c
23) \(H_{0}:\) The number of defective parts is independent on the machine that produced it. \(H_{1}:\) The number of defective parts is dependent on the machine that produced it. \(\chi^{2}\) = 2.3536; p-value = 0.5023; do not reject H0. There is not enough evidence to support the claim that the number of defective parts is dependent on the machine that produced it.
25) \(H_{0}:\) The proportion of customers who will go out to eat on New Year’s Eve is independent of location. \(H_{1}:\) The proportion of customers who will go out to eat on New Year’s Eve is dependent on location. \(\chi^{2}\) = 2.2772; p-value = 0.3203; do not reject \(H_{0}\). There is not enough evidence to support the claim that the proportion of customers who will go out to eat on New Year’s Eve is dependent on location.
27) \(H_{0}:\) The math placement exam and where students are placed are independent. \(H_{1}:\) The math placement exam and which middle school students attend are dependent. \(\chi^{2}\) = 0.1642; p-value = 0.9212; do not reject \(H_{0}\). There is not enough evidence to support the claim that the math placement exam and which middle school students attend are dependent.
29) \(H_{0}:\) Department and LMS preference are independent. \(H_{1}:\) Department and LMS preference are dependent. \(\chi^{2}\) = 24.7778; p-value = 0.000056; reject \(H_{0}\). There is enough evidence to support the claim that department and LMS preference are dependent.
31) \(H_{0}:\) Type of electronic device and store branch are dependent. \(H_{1}:\) Type of electronic device and store branch are dependent. \(\chi^{2}\) = 7.4224; p-value = 0.8285; do not reject \(H_{0}\). There is not enough evidence to support the claim that type of electronic device and store branch are dependent.
33) \(H_{0}:\) Having a job in college and year in school are not related. \(H_{1}:\) Having a job in college and year in school are related. \(\chi^{2}\) = 20.8875; p-value = 0.0001; reject \(H_{0}\). There is enough evidence to support the claim that having a job in college and year in school are related.