7.4: Z-Interval for a Mean
- Page ID
- 24052

Suppose you want to estimate the mean weight of newborn infants, or you want to estimate the mean salary of college graduates. A confidence interval for the mean would be the way to estimate these means.
A 100(1 - \(\alpha\) )% confidence interval for a population mean μ: (σ known) Choose a simple random sample of size n from a population having unknown mean μ. The 100(1 - \(\alpha\))% confidence interval estimate for μ is given by, \(\bar{x} \pm z_{\alpha / 2}\left(\frac{\sigma}{\sqrt{n}}\right)\).
The point estimate for μ is \(\overline{ x }\), and the margin of error is \(z_{\alpha / 2}\left(\frac{\sigma}{\sqrt{n}}\right)\).
Where \(z_\frac{\alpha}{2}\) is the value on the standard normal curve with area 1 – \(\alpha\) between the critical values –z\(\alpha\)/2 and +z\(\alpha\)/2, as shown below in Figure 7-2.

Note: In the notation, z\(\alpha\)/2 the \(\alpha\)/2 represents the area in each of the tails, see Figure 7-2.
The confidence interval can be expressed as an inequality or an interval of values.
\(\bar{x}-z_{\alpha / 2} \cdot \frac{\sigma}{\sqrt{n}}<\mu<\bar{x}+z_{\alpha / 2} \cdot \frac{\sigma}{\sqrt{n}} \quad \text { or } \quad\left(\bar{x}-z_{\alpha / 2} \cdot \frac{\sigma}{\sqrt{n}}, \bar{x}+z_{\alpha / 2} \cdot \frac{\sigma}{\sqrt{n}}\right)\)
Assumptions:
1. If the sample size is small (n < 30), the population we are sampling from must be normally distributed. If the sample size is “large” (n ≥ 30) the Central Limit Theorem guarantees that the sampling distribution of the mean will be normally distributed no matter how the population distribution is distributed.
2. The population standard deviation σ must be known. Most of the time we are using σ from a similar study or a prior year’s data. If you have a sample standard deviation then we will use a different method introduced in a later section.
These assumptions must be addressed before using these statistical inferences. In most cases, we do not know the population standard deviation so will not use the z-interval. Instead, we will use a different sampling distribution called the Student’s t-distribution or t-distribution for short.
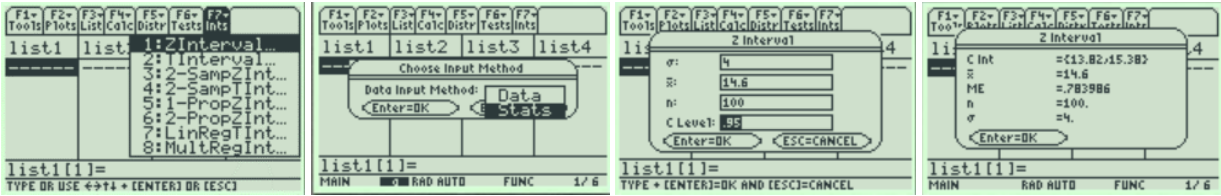
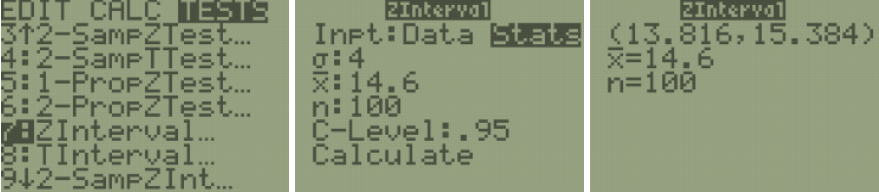
Suppose we select a random sample of 100 pennies in circulation in order to estimate the average age of all pennies that are still in circulation. The sample average age, in years, was found to be \(\overline{ x }\) = 14.6. For the sake of this example, let us assume that the population standard deviation is 4 years old. Find a 95% confidence interval for the true average age of pennies that are still in circulation.
Solution
We can use the above (z) model because σ is known, the population distribution shape is unknown, but the sample size is over 30.
Use Excel or your calculator to find z\(\alpha\)/2 for a 95% confidence interval. In Excel use =NORM.INV(lower tail area, mean, standard deviation). It is easier to deal with the positive z-score so use the z to the right of the mean which would have 1 – \(\alpha\)/2 = 0.975 area. In Excel use =NORM.INV(0.975,0,1) or the calculator invNorm(0.975,0,1) which gives z\(\alpha\)/2 = 1.96.
\(\bar{x} \pm z_\frac{\alpha}{2} \frac{\sigma}{\sqrt{n}} \quad \Rightarrow \quad 14.6 \pm 1.96\left(\frac{4}{\sqrt{100}}\right) \quad \Rightarrow \quad 14.6 \pm 0.784 \quad \Rightarrow (13.816, 15.384) \)
The point estimate for μ is 14.6 years, and the margin of error is 0.784 years. If we were to repeat this same sampling process, we would expect 95 out of 100 such intervals to contain the true population mean age of all pennies in circulation. A shorthand way to say this is, with 95% confidence that the population mean age of all pennies in circulation is between 13.816 to 15.384 years.
The answer is expressed as an inequality so the confidence interval is 13.816 < µ < 15.384. You can also use interval notation (13.816, 15.384) which is more common and matches the notation found on most calculators.
TI-84: Press the [STAT] key, arrow over to the [TESTS] menu, arrow down to the [7:ZInterval] option and press the [ENTER] key. Arrow over to the [Stats] menu and press the [ENTER] key. Then type in the population or sample standard deviation, sample mean, sample size and confidence level, arrow down to [Calculate] and press the [ENTER] key. The calculator returns the answer in interval notation.
TI-89: Go to the [Apps] Stat/List Editor, then press [2nd] then F7 [Ints], then select 1: ZInterval. Choose the input method, data is when you have entered data into a list previously or stats when you are given the mean and standard deviation already. Type in the population standard deviation, sample mean, sample size (or list name (list1), and Freq: 1) and confidence level, and press the [ENTER] key to calculate. The calculator returns the answer in interval notation.