
1.2: Samples vs. Populations
- Page ID
- 24019

\( \newcommand{\vecs}[1]{\overset { \scriptstyle \rightharpoonup} {\mathbf{#1}} } \)
\( \newcommand{\vecd}[1]{\overset{-\!-\!\rightharpoonup}{\vphantom{a}\smash {#1}}} \)
\( \newcommand{\dsum}{\displaystyle\sum\limits} \)
\( \newcommand{\dint}{\displaystyle\int\limits} \)
\( \newcommand{\dlim}{\displaystyle\lim\limits} \)
\( \newcommand{\id}{\mathrm{id}}\) \( \newcommand{\Span}{\mathrm{span}}\)
( \newcommand{\kernel}{\mathrm{null}\,}\) \( \newcommand{\range}{\mathrm{range}\,}\)
\( \newcommand{\RealPart}{\mathrm{Re}}\) \( \newcommand{\ImaginaryPart}{\mathrm{Im}}\)
\( \newcommand{\Argument}{\mathrm{Arg}}\) \( \newcommand{\norm}[1]{\| #1 \|}\)
\( \newcommand{\inner}[2]{\langle #1, #2 \rangle}\)
\( \newcommand{\Span}{\mathrm{span}}\)
\( \newcommand{\id}{\mathrm{id}}\)
\( \newcommand{\Span}{\mathrm{span}}\)
\( \newcommand{\kernel}{\mathrm{null}\,}\)
\( \newcommand{\range}{\mathrm{range}\,}\)
\( \newcommand{\RealPart}{\mathrm{Re}}\)
\( \newcommand{\ImaginaryPart}{\mathrm{Im}}\)
\( \newcommand{\Argument}{\mathrm{Arg}}\)
\( \newcommand{\norm}[1]{\| #1 \|}\)
\( \newcommand{\inner}[2]{\langle #1, #2 \rangle}\)
\( \newcommand{\Span}{\mathrm{span}}\) \( \newcommand{\AA}{\unicode[.8,0]{x212B}}\)
\( \newcommand{\vectorA}[1]{\vec{#1}} % arrow\)
\( \newcommand{\vectorAt}[1]{\vec{\text{#1}}} % arrow\)
\( \newcommand{\vectorB}[1]{\overset { \scriptstyle \rightharpoonup} {\mathbf{#1}} } \)
\( \newcommand{\vectorC}[1]{\textbf{#1}} \)
\( \newcommand{\vectorD}[1]{\overrightarrow{#1}} \)
\( \newcommand{\vectorDt}[1]{\overrightarrow{\text{#1}}} \)
\( \newcommand{\vectE}[1]{\overset{-\!-\!\rightharpoonup}{\vphantom{a}\smash{\mathbf {#1}}}} \)
\( \newcommand{\vecs}[1]{\overset { \scriptstyle \rightharpoonup} {\mathbf{#1}} } \)
\(\newcommand{\longvect}{\overrightarrow}\)
\( \newcommand{\vecd}[1]{\overset{-\!-\!\rightharpoonup}{\vphantom{a}\smash {#1}}} \)
\(\newcommand{\avec}{\mathbf a}\) \(\newcommand{\bvec}{\mathbf b}\) \(\newcommand{\cvec}{\mathbf c}\) \(\newcommand{\dvec}{\mathbf d}\) \(\newcommand{\dtil}{\widetilde{\mathbf d}}\) \(\newcommand{\evec}{\mathbf e}\) \(\newcommand{\fvec}{\mathbf f}\) \(\newcommand{\nvec}{\mathbf n}\) \(\newcommand{\pvec}{\mathbf p}\) \(\newcommand{\qvec}{\mathbf q}\) \(\newcommand{\svec}{\mathbf s}\) \(\newcommand{\tvec}{\mathbf t}\) \(\newcommand{\uvec}{\mathbf u}\) \(\newcommand{\vvec}{\mathbf v}\) \(\newcommand{\wvec}{\mathbf w}\) \(\newcommand{\xvec}{\mathbf x}\) \(\newcommand{\yvec}{\mathbf y}\) \(\newcommand{\zvec}{\mathbf z}\) \(\newcommand{\rvec}{\mathbf r}\) \(\newcommand{\mvec}{\mathbf m}\) \(\newcommand{\zerovec}{\mathbf 0}\) \(\newcommand{\onevec}{\mathbf 1}\) \(\newcommand{\real}{\mathbb R}\) \(\newcommand{\twovec}[2]{\left[\begin{array}{r}#1 \\ #2 \end{array}\right]}\) \(\newcommand{\ctwovec}[2]{\left[\begin{array}{c}#1 \\ #2 \end{array}\right]}\) \(\newcommand{\threevec}[3]{\left[\begin{array}{r}#1 \\ #2 \\ #3 \end{array}\right]}\) \(\newcommand{\cthreevec}[3]{\left[\begin{array}{c}#1 \\ #2 \\ #3 \end{array}\right]}\) \(\newcommand{\fourvec}[4]{\left[\begin{array}{r}#1 \\ #2 \\ #3 \\ #4 \end{array}\right]}\) \(\newcommand{\cfourvec}[4]{\left[\begin{array}{c}#1 \\ #2 \\ #3 \\ #4 \end{array}\right]}\) \(\newcommand{\fivevec}[5]{\left[\begin{array}{r}#1 \\ #2 \\ #3 \\ #4 \\ #5 \\ \end{array}\right]}\) \(\newcommand{\cfivevec}[5]{\left[\begin{array}{c}#1 \\ #2 \\ #3 \\ #4 \\ #5 \\ \end{array}\right]}\) \(\newcommand{\mattwo}[4]{\left[\begin{array}{rr}#1 \amp #2 \\ #3 \amp #4 \\ \end{array}\right]}\) \(\newcommand{\laspan}[1]{\text{Span}\{#1\}}\) \(\newcommand{\bcal}{\cal B}\) \(\newcommand{\ccal}{\cal C}\) \(\newcommand{\scal}{\cal S}\) \(\newcommand{\wcal}{\cal W}\) \(\newcommand{\ecal}{\cal E}\) \(\newcommand{\coords}[2]{\left\{#1\right\}_{#2}}\) \(\newcommand{\gray}[1]{\color{gray}{#1}}\) \(\newcommand{\lgray}[1]{\color{lightgray}{#1}}\) \(\newcommand{\rank}{\operatorname{rank}}\) \(\newcommand{\row}{\text{Row}}\) \(\newcommand{\col}{\text{Col}}\) \(\renewcommand{\row}{\text{Row}}\) \(\newcommand{\nul}{\text{Nul}}\) \(\newcommand{\var}{\text{Var}}\) \(\newcommand{\corr}{\text{corr}}\) \(\newcommand{\len}[1]{\left|#1\right|}\) \(\newcommand{\bbar}{\overline{\bvec}}\) \(\newcommand{\bhat}{\widehat{\bvec}}\) \(\newcommand{\bperp}{\bvec^\perp}\) \(\newcommand{\xhat}{\widehat{\xvec}}\) \(\newcommand{\vhat}{\widehat{\vvec}}\) \(\newcommand{\uhat}{\widehat{\uvec}}\) \(\newcommand{\what}{\widehat{\wvec}}\) \(\newcommand{\Sighat}{\widehat{\Sigma}}\) \(\newcommand{\lt}{<}\) \(\newcommand{\gt}{>}\) \(\newcommand{\amp}{&}\) \(\definecolor{fillinmathshade}{gray}{0.9}\)The first thing to decide in a statistical study is whom you want to measure and what you want to measure. You always want to make sure that you can answer the question of whom you measured and what you measured. The “who” is known as the individual and the “what” is known as the variable.
Individual – a person, case or object that you are interested in finding out information about.
Variable (also known as a random variable) – the measurement or observation of the individual.
Population – is the total set of all the observations that are the subject of a study.
Notice, the population answers “who” you want to measure and the variable answers “what” you want to measure. Make sure that you always answer both of these questions or you have not given the audience reading your study the entire picture. As an example, if you just say that you are going to collect data from the senators in the United States Congress, you have not told your reader what you are going to collect. Do you want to know their income, their highest degree earned, their voting record, their age, their political party, their gender, their marital status, or how they feel about a particular issue? Without telling “what” you what to measure, your reader has no idea what your study is actually about.
Sometimes the population is very easy to collect. If you are interested in finding the average age of all of the current senators in the United States Congress, there are only 100 senators. This would not be hard to find. However, if instead you were interested in knowing the average age that a senator in the United States Congress first took office for all senators that ever served in the United States Congress, then this would be a bit more work. It is still doable, but it would take a bit of time to collect. However, what if you are interested in finding the average diameter at breast height of all Ponderosa Pine trees in the Coconino National Forest? This data would be impossible to collect. What do you do in these cases? Instead of collecting the entire population, you take a smaller group of the population, a snapshot of the population. This smaller group, called a sample, is a subset of the population, see Figure 1-1.
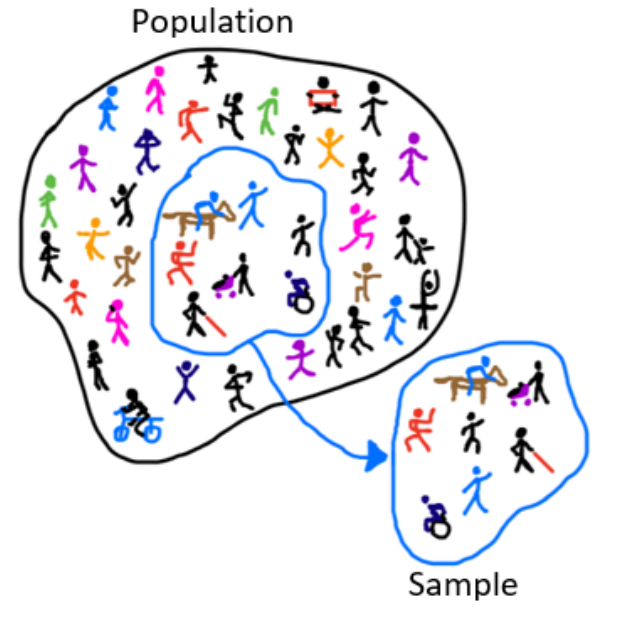
Sample – a subset from the population.
Consider the following three research questions:
- What is the average mercury content in albacore tuna in the Pacific Ocean?
- Over the last 5 years, what is the average time to complete a degree for Portland State University undergraduate students?
- Does a new drug reduce the number of deaths in patients with severe heart disease?
Each research question refers to a target population. In the first question, the target population is all albacore tuna in the Pacific Ocean, and each fish represents a case.
A sample represents a subset of the cases and is often a small fraction of the population. For instance, 60 albacore tuna in the population might be selected and the mercury level is measured in each fish. The sample average of the 60 fish may then be used to provide an estimate of the population average of all the fish and answer the research question.
We use the lower-case n to represent the number of cases in the sample and the upper-case N to represent the number of cases in the population.
n = sample size.
N = population size.
How the sample is collected can determine the accuracy of the results of your study. There are many ways to collect samples. No sampling method is perfect, but some methods are better than other methods. Sampling techniques will be discussed in more detail later.
For now, realize that every time you take a sample you will find different data values. The sample is a snapshot of the population, and there is more information than is in this small picture. The idea is to try to collect a sample that gives you an accurate picture, but you will never know for sure if your picture is the correct picture. Unlike previous mathematics classes, where there was always one right answer, in statistics there can be many answers, and you do not know which are right.
The sample average in this case is the statistic, and the population average is the parameter. We use sample statistics to make inferences, educated guesses made by observation, about the population parameter.
Once you have your data, either from a population or from a sample, you need to know how you want to summarize the data.
As an example, suppose you are interested in finding the proportion of people who like a candidate, the average height a plant grows to using a new fertilizer, or the variability of the test scores. Understanding how you want to summarize the data helps to determine the type of data you want to collect. Since the population is what we are interested in, then you want to calculate a number from the population. This is known as a parameter.
Parameter – An unknown quantity from the population. Usually denoted with a Greek letter (for example μ “mu”). This number is a fixed, unknown number that we want to estimate.
As mentioned already, it is hard to collect the entire population. Even though this is the number you are interested in, you cannot really calculate it. Instead, you use the number calculated from the sample, called a statistic, to estimate the parameter.
Statistic – a number calculated from the sample. Usually denoted with a ^ (called a hat, for example \(\hat{p}\) “p-hat”) or a – (called a bar, for example \(\bar{x}\) “x-bar”) above the letter.
Since most samples are not exactly the same, the statistic values are going to be different from sample to sample. Statistics estimate the value of the parameter, but again, you do not know for sure if your statistic is correctly estimating the parameter.