
15.3.4: Chapter 5 Lab
- Page ID
- 28618

\( \newcommand{\vecs}[1]{\overset { \scriptstyle \rightharpoonup} {\mathbf{#1}} } \) \( \newcommand{\vecd}[1]{\overset{-\!-\!\rightharpoonup}{\vphantom{a}\smash {#1}}} \)\(\newcommand{\id}{\mathrm{id}}\) \( \newcommand{\Span}{\mathrm{span}}\) \( \newcommand{\kernel}{\mathrm{null}\,}\) \( \newcommand{\range}{\mathrm{range}\,}\) \( \newcommand{\RealPart}{\mathrm{Re}}\) \( \newcommand{\ImaginaryPart}{\mathrm{Im}}\) \( \newcommand{\Argument}{\mathrm{Arg}}\) \( \newcommand{\norm}[1]{\| #1 \|}\) \( \newcommand{\inner}[2]{\langle #1, #2 \rangle}\) \( \newcommand{\Span}{\mathrm{span}}\) \(\newcommand{\id}{\mathrm{id}}\) \( \newcommand{\Span}{\mathrm{span}}\) \( \newcommand{\kernel}{\mathrm{null}\,}\) \( \newcommand{\range}{\mathrm{range}\,}\) \( \newcommand{\RealPart}{\mathrm{Re}}\) \( \newcommand{\ImaginaryPart}{\mathrm{Im}}\) \( \newcommand{\Argument}{\mathrm{Arg}}\) \( \newcommand{\norm}[1]{\| #1 \|}\) \( \newcommand{\inner}[2]{\langle #1, #2 \rangle}\) \( \newcommand{\Span}{\mathrm{span}}\)\(\newcommand{\AA}{\unicode[.8,0]{x212B}}\)
Cross‐tabulation and Two Way Tables
Open the Minitab file lab04.mpj from the website.
Here is a description of the data collected from elementary schools in Michigan:
- Gender: (Boy, Girl)
- Grade: 4, 5 or 6
- Age: Age in years
- Ethnicity: White, Other (Yes, that was the way it was reported when this data was collected!)
- Location: Rural, Suburban, Urban
- School: 1=Brentwood Elementary, 2=Brentwood Middle, 3=Ridge, 4=Sand, 5=Eureka, 6=Brown, 7=Main, 8=Portage, 9=Westdale Middle
- Goals: Student's choice in the personal goals: 1=Make Good Grades, 2=Be Popular, 3=Be Good in Sports
- Grades: Rank of "make good grades" (1=most important for popularity, 4=least important)
- Sports: Rank of "being good at sports" (1=most important for popularity, 4=least important)
- Looks: Rank of "being handsome or pretty" (1=most important for popularity, 4=least important)
- Money: Rank of "having lots of money" (1=most important for popularity, 4=least important)
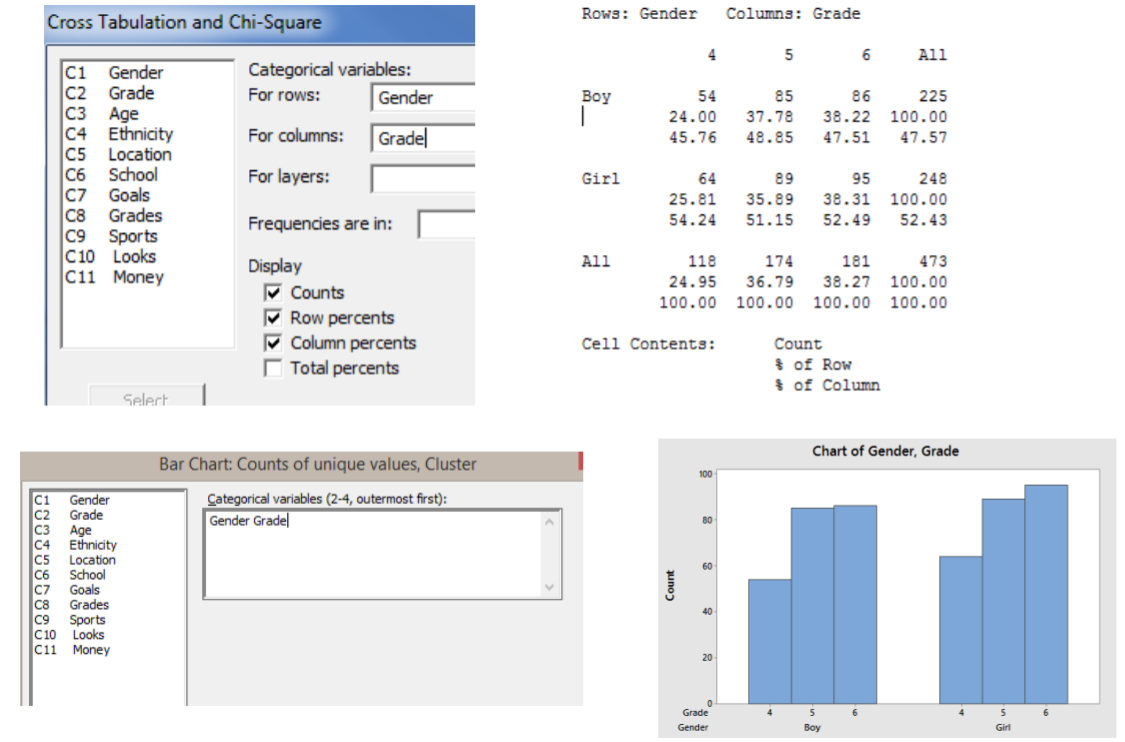
Cross Tabulation is a method of taking pairs of categorical variables and creating a two‐way table. The command can be found on the menu bar STAT>TABLES>CROSSTABULATION. Choose two data items and check that you want count, row percents and column percents. You can also make a clustered bar graph GRAPHS>BAR GRAPH>CLUSTERED. The example shows gender cross‐tabulated with grade level:
- Cross‐tabulate Gender with Goal and create a two‐way table. Create a clustered bar graph. Paste them both here.
- What is the probability a randomly selected student chooses sports as the most important goal? What type of probability is this (Marginal, Joint, or Conditional)?
- What is probability that a randomly selected student is a boy? What type of probability is this (Marginal, Joint, or Conditional)?
- What is probability that a randomly selected student is a boy and chooses sports as the most important goal? What type of probability is this (Marginal, Joint, or Conditional)?
- What is the probability ca randomly selected boy chooses sports as the most important goal? What type of probability is this (Marginal, Joint, or Conditional)?
- What conclusions can you make about Gender and Goal?
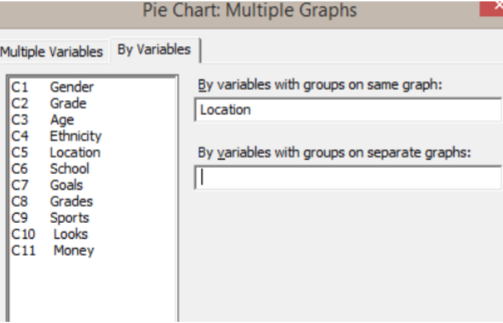
- Cross‐tabulate Location with Goal and create a two‐way table. Create a pie graphs for Goal with a multiple variable Location on the same graph. Paste the cross‐tabulation and pie graphs here
- What is the probability that a randomly selected student chooses sports as the most important goal?
- What is probability that a randomly selected suburban student chooses sports?
- What is the probability that a randomly selected rural student chooses sports?
- What is the probability that a randomly selected urban student chooses sports?
- What conclusions can you make about Location and Goal?
- Cross‐tabulate any two variables of your choice and create a two‐way table. Create a clustered bar graph. Paste them both here.
- Calculate and explain any marginal probability of your choice.
- Calculate and explain any joint probability of your choice.
- Calculate and explain any conditional probability of your choice.
- What conclusions can you make about these two variables?