
14.4: Hypothesis Test for Simple Linear Regression
- Page ID
- 20929

We will now describe a hypothesis test to determine if the regression model is meaningful; in other words, does the value of \(X\) in any way help predict the expected value of \(Y\)?
Model Assumptions
- The residual errors are random and are normally distributed.
- The standard deviation of the residual error does not depend on \(X\)
- A linear relationship exists between \(X\) and \(Y\)
- The samples are randomly selected
Test Hypotheses
\(H_o\): \(X\) and \(Y\) are not correlated
\(H_a\): \(X\) and \(Y\) are correlated
\(H_o\): \(\beta_1\) (slope) = 0
\(H_a\): \(\beta_1\) (slope) ≠ 0
Test Statistic
\(F=\dfrac{M S_{\text {Regression }}}{M S_{\text {Error }}}\)
\(d f_{\text {num }}=1\)
\(d f_{\text {den }}=n-2\)
Sum of Squares
\(S S_{\text {Total }}=\sum(Y-\bar{Y})^{2}\)
\(S S_{\text {Error }}=\sum(Y-\hat{Y})^{2}\)
\(S S_{\text {Regression }}=S S_{\text {Total }}-S S_{\text {Error }}\)
In simple linear regression, this is equivalent to saying “Are X an Y correlated?”
In reviewing the model, \(Y=\beta_{0}+\beta_{1} X+\varepsilon\), as long as the slope (\(\beta_{1}\)) has any non‐zero value, \(X\) will add value in helping predict the expected value of \(Y\). However, if there is no correlation between X and Y, the value of the slope (\(\beta_{1}\)) will be zero. The model we can use is very similar to One Factor ANOVA.
The Results of the test can be summarized in a special ANOVA table:
| Source of Variation | Sum of Squares (SS) | Degrees of freedom (df) | Mean Square (MS) | \(F\) |
|---|---|---|---|---|
| Factor (due to X) | \(\mathrm{SS}_{\text {Regression }}\) | 1 | \(\mathrm{MS}_{\text {Factor }}=\mathrm{SS}_{\text {Factor }} / 1\) | \(\mathrm{F}=\mathrm{MS}_{\text {Factor }} / \mathrm{MS}_{\text {Error }}\) |
| Error (Residual) | \(\mathrm{SS}_{\text {Error }}\) | \(n-2\) | \(\mathrm{MS}_{\text {Error }}=\mathrm{SS}_{\text {Error }} / \mathrm{n}-2\) | |
| Total | \(\mathrm{SS}_{\text {Total }}\) | \(n-1\) |
Design: Is there a significant correlation between rainfall and sales of sunglasses?
Research Hypotheses:
\(H_o\): Sales and Rainfall are not correlated \(H_o\): 1 (slope) = 0
\(H_a\): Sales and Rainfall are correlated \(H_a\): 1 (slope) ≠ 0
Type I error would be to reject the Null Hypothesis and \(t\) claim that rainfall is correlated with sales of sunglasses, when they are not correlated. The test will be run at a level of significance (\(\alpha\)) of 5%.
The test statistic from the table will be \(\mathrm{F}=\dfrac{\text { MSRegression }}{\text { MSError }}\). The degrees of freedom for the numerator will be 1, and the degrees of freedom for denominator will be 5‐2=3.
Critical Value for \(F\) at \(\alpha\)of 5% with \(df_{num}=1\) and \(df_{den}=3} is 10.13. Reject \(H_o\) if \(F >10.13\). We will also run this test using the \(p\)‐value method with statistical software, such as Minitab.
Data/Results
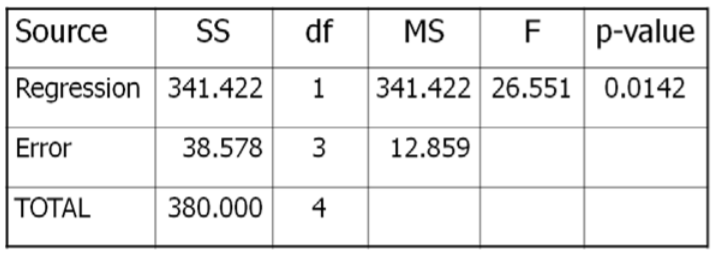
\(F=341.422 / 12.859=26.551\), which is more than the critical value of 10.13, so Reject \(H_o\). Also, the \(p\)‐value = 0.0142 < 0.05 which also supports rejecting \(H_o\).
Conclusion
Sales of Sunglasses and Rainfall are negatively correlated.