
24.4: Correlation and Causation
- Page ID
- 8844

\( \newcommand{\vecs}[1]{\overset { \scriptstyle \rightharpoonup} {\mathbf{#1}} } \)
\( \newcommand{\vecd}[1]{\overset{-\!-\!\rightharpoonup}{\vphantom{a}\smash {#1}}} \)
\( \newcommand{\dsum}{\displaystyle\sum\limits} \)
\( \newcommand{\dint}{\displaystyle\int\limits} \)
\( \newcommand{\dlim}{\displaystyle\lim\limits} \)
\( \newcommand{\id}{\mathrm{id}}\) \( \newcommand{\Span}{\mathrm{span}}\)
( \newcommand{\kernel}{\mathrm{null}\,}\) \( \newcommand{\range}{\mathrm{range}\,}\)
\( \newcommand{\RealPart}{\mathrm{Re}}\) \( \newcommand{\ImaginaryPart}{\mathrm{Im}}\)
\( \newcommand{\Argument}{\mathrm{Arg}}\) \( \newcommand{\norm}[1]{\| #1 \|}\)
\( \newcommand{\inner}[2]{\langle #1, #2 \rangle}\)
\( \newcommand{\Span}{\mathrm{span}}\)
\( \newcommand{\id}{\mathrm{id}}\)
\( \newcommand{\Span}{\mathrm{span}}\)
\( \newcommand{\kernel}{\mathrm{null}\,}\)
\( \newcommand{\range}{\mathrm{range}\,}\)
\( \newcommand{\RealPart}{\mathrm{Re}}\)
\( \newcommand{\ImaginaryPart}{\mathrm{Im}}\)
\( \newcommand{\Argument}{\mathrm{Arg}}\)
\( \newcommand{\norm}[1]{\| #1 \|}\)
\( \newcommand{\inner}[2]{\langle #1, #2 \rangle}\)
\( \newcommand{\Span}{\mathrm{span}}\) \( \newcommand{\AA}{\unicode[.8,0]{x212B}}\)
\( \newcommand{\vectorA}[1]{\vec{#1}} % arrow\)
\( \newcommand{\vectorAt}[1]{\vec{\text{#1}}} % arrow\)
\( \newcommand{\vectorB}[1]{\overset { \scriptstyle \rightharpoonup} {\mathbf{#1}} } \)
\( \newcommand{\vectorC}[1]{\textbf{#1}} \)
\( \newcommand{\vectorD}[1]{\overrightarrow{#1}} \)
\( \newcommand{\vectorDt}[1]{\overrightarrow{\text{#1}}} \)
\( \newcommand{\vectE}[1]{\overset{-\!-\!\rightharpoonup}{\vphantom{a}\smash{\mathbf {#1}}}} \)
\( \newcommand{\vecs}[1]{\overset { \scriptstyle \rightharpoonup} {\mathbf{#1}} } \)
\(\newcommand{\longvect}{\overrightarrow}\)
\( \newcommand{\vecd}[1]{\overset{-\!-\!\rightharpoonup}{\vphantom{a}\smash {#1}}} \)
\(\newcommand{\avec}{\mathbf a}\) \(\newcommand{\bvec}{\mathbf b}\) \(\newcommand{\cvec}{\mathbf c}\) \(\newcommand{\dvec}{\mathbf d}\) \(\newcommand{\dtil}{\widetilde{\mathbf d}}\) \(\newcommand{\evec}{\mathbf e}\) \(\newcommand{\fvec}{\mathbf f}\) \(\newcommand{\nvec}{\mathbf n}\) \(\newcommand{\pvec}{\mathbf p}\) \(\newcommand{\qvec}{\mathbf q}\) \(\newcommand{\svec}{\mathbf s}\) \(\newcommand{\tvec}{\mathbf t}\) \(\newcommand{\uvec}{\mathbf u}\) \(\newcommand{\vvec}{\mathbf v}\) \(\newcommand{\wvec}{\mathbf w}\) \(\newcommand{\xvec}{\mathbf x}\) \(\newcommand{\yvec}{\mathbf y}\) \(\newcommand{\zvec}{\mathbf z}\) \(\newcommand{\rvec}{\mathbf r}\) \(\newcommand{\mvec}{\mathbf m}\) \(\newcommand{\zerovec}{\mathbf 0}\) \(\newcommand{\onevec}{\mathbf 1}\) \(\newcommand{\real}{\mathbb R}\) \(\newcommand{\twovec}[2]{\left[\begin{array}{r}#1 \\ #2 \end{array}\right]}\) \(\newcommand{\ctwovec}[2]{\left[\begin{array}{c}#1 \\ #2 \end{array}\right]}\) \(\newcommand{\threevec}[3]{\left[\begin{array}{r}#1 \\ #2 \\ #3 \end{array}\right]}\) \(\newcommand{\cthreevec}[3]{\left[\begin{array}{c}#1 \\ #2 \\ #3 \end{array}\right]}\) \(\newcommand{\fourvec}[4]{\left[\begin{array}{r}#1 \\ #2 \\ #3 \\ #4 \end{array}\right]}\) \(\newcommand{\cfourvec}[4]{\left[\begin{array}{c}#1 \\ #2 \\ #3 \\ #4 \end{array}\right]}\) \(\newcommand{\fivevec}[5]{\left[\begin{array}{r}#1 \\ #2 \\ #3 \\ #4 \\ #5 \\ \end{array}\right]}\) \(\newcommand{\cfivevec}[5]{\left[\begin{array}{c}#1 \\ #2 \\ #3 \\ #4 \\ #5 \\ \end{array}\right]}\) \(\newcommand{\mattwo}[4]{\left[\begin{array}{rr}#1 \amp #2 \\ #3 \amp #4 \\ \end{array}\right]}\) \(\newcommand{\laspan}[1]{\text{Span}\{#1\}}\) \(\newcommand{\bcal}{\cal B}\) \(\newcommand{\ccal}{\cal C}\) \(\newcommand{\scal}{\cal S}\) \(\newcommand{\wcal}{\cal W}\) \(\newcommand{\ecal}{\cal E}\) \(\newcommand{\coords}[2]{\left\{#1\right\}_{#2}}\) \(\newcommand{\gray}[1]{\color{gray}{#1}}\) \(\newcommand{\lgray}[1]{\color{lightgray}{#1}}\) \(\newcommand{\rank}{\operatorname{rank}}\) \(\newcommand{\row}{\text{Row}}\) \(\newcommand{\col}{\text{Col}}\) \(\renewcommand{\row}{\text{Row}}\) \(\newcommand{\nul}{\text{Nul}}\) \(\newcommand{\var}{\text{Var}}\) \(\newcommand{\corr}{\text{corr}}\) \(\newcommand{\len}[1]{\left|#1\right|}\) \(\newcommand{\bbar}{\overline{\bvec}}\) \(\newcommand{\bhat}{\widehat{\bvec}}\) \(\newcommand{\bperp}{\bvec^\perp}\) \(\newcommand{\xhat}{\widehat{\xvec}}\) \(\newcommand{\vhat}{\widehat{\vvec}}\) \(\newcommand{\uhat}{\widehat{\uvec}}\) \(\newcommand{\what}{\widehat{\wvec}}\) \(\newcommand{\Sighat}{\widehat{\Sigma}}\) \(\newcommand{\lt}{<}\) \(\newcommand{\gt}{>}\) \(\newcommand{\amp}{&}\) \(\definecolor{fillinmathshade}{gray}{0.9}\)When we say that one thing causes another, what do we mean? There is a long history in philosophy of discussion about the meaning of causality, but in statistics one way that we commonly think of causation is in terms of experimental control. That is, if we think that factor X causes factor Y, then manipulating the value of X should also change the value of Y.
In medicine, there is a set of ideas known as Koch’s postulates which have historically been used to determine whether a particular organism causes a disease. The basic idea is that the organism should be present in people with the disease, and not present in those without it – thus, a treatment that eliminates the organism should also eliminate the disease. Further, infecting someone with the organism should cause them to contract the disease. An example of this was seen in the work of Dr. Barry Marshall, who had a hypothesis that stomach ulcers were caused by a bacterium (Helicobacter pylori). To demonstrate this, he infected himself with the bacterium, and soon thereafter developed severe inflammation in his stomach. He then treated himself with an antibiotic, and his stomach soon recovered. He later won the Nobel Prize in Medicine for this work.
Often we would like to test causal hypotheses but we can’t actually do an experiment, either because it’s impossible (“What is the relationship between human carbon emissions and the earth’s climate?”) or unethical (“What are the effects of severe abuse on child brain development?”). However, we can still collect data that might be relevant to those questions. For example, in the latter example, we can potentially collect data from children who have been abused as well as those who have not, and we can then ask whether their brain development differs.
Let’s say that we did such an analysis, and we found that abused children had poorer brain development than non-abused children. Would this demonstrate that abuse causes poorer brain development? No. Whenever we observe a statistical association between two variables, it is certainly possible that one of those two variables causes the other. However, it is also possible that both of the variables are being influenced by a third variable; in this example, it could be that child abuse is associated with family stress, which could also cause poorer brain development through less intellectual engagement, food stress, or many other possible avenues. The point is that a correlation between two variables generally tells us that something is probably causing somethign else, but it doesn’t tell us what is causing what.
24.4.1 Causal graphs
One useful way to describe causal relations between variables is through a causal graph, which shows variables as circles and causal relations between them as arrows. For example, Figure 24.4 shows the causal relationships between study time and two variables that we think should be affected by it: exam grades and exam finishing times.
However, in reality the effects on finishing time and grades are not due directly to the amount of time spent studying, but rather to the amount of knowledge that the student gains by studying. We would usually say that knowledge is a latent variable – that is, we can’t measure it directly but we can see it reflected in variables that we can measure (like grades and finishing times). Figure 24.5 shows this.
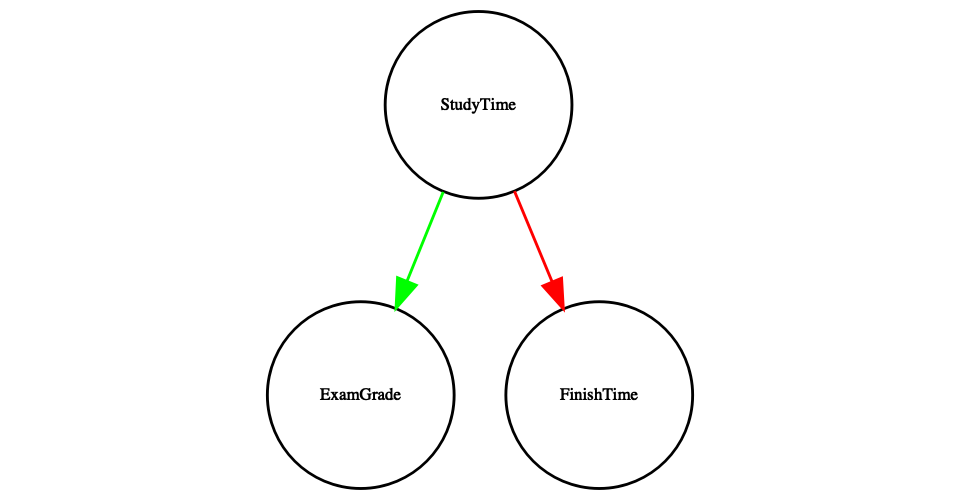
Figure 24.4: A graph showing causal relationships between three variables: study time, exam grades, and exam finishing time. A green arrow represents a positive relationship (i.e. more study time causes exam grades to increase), and a red arrow represents a negative relationship (i.e. more study time causes faster completion of the exam).
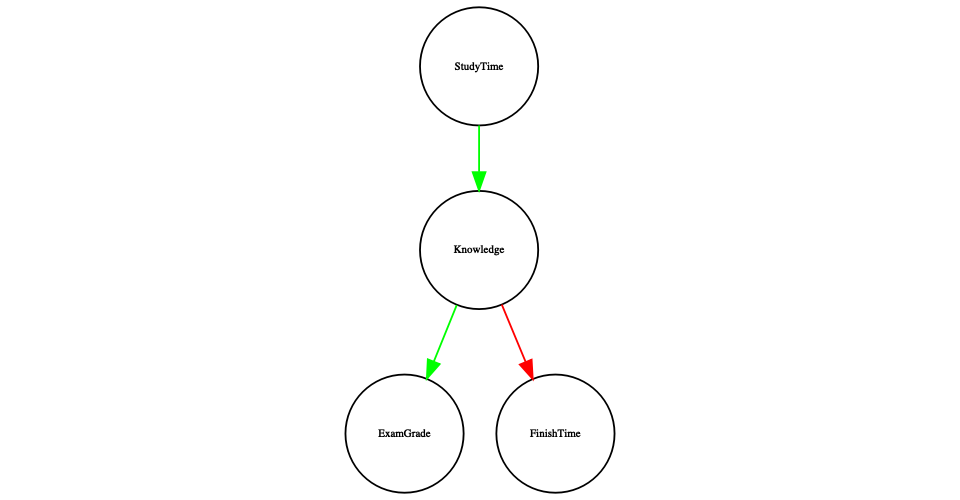
Figure 24.5: A graph showing the same causal relationships as above, but now also showing the latent variable (knowledge) using a square box.
Here we would say that knowledge mediates the relationship between study time and grades/finishing times. That means that if we were able to hold knowledge constant (for example, by administering a drug that causes immediate forgetting), then the amount of study time should no longer have an effect on grades and finishing times.
Note that if we simply measured exam grades and finishing times we would generally see negative relationship between them, because people who finish exams the fastest in general get the highest grades. However, if we were to interpret this correlation as a causal relation, this would tell us that in order to get better grades, we should actually finish the exam more quickly! This example shows how tricky the inference of causality from non-experimental data can be.
Within statistics and machine learning, there is a very active research community that is currently studying the question of when and how we can infer causal relationships from non-experimental data. However, these methods often require strong assumptions, and must generally be used with great caution.