
11.3: Biometrics Lab #3
- Page ID
- 2941

\( \newcommand{\vecs}[1]{\overset { \scriptstyle \rightharpoonup} {\mathbf{#1}} } \)
\( \newcommand{\vecd}[1]{\overset{-\!-\!\rightharpoonup}{\vphantom{a}\smash {#1}}} \)
\( \newcommand{\dsum}{\displaystyle\sum\limits} \)
\( \newcommand{\dint}{\displaystyle\int\limits} \)
\( \newcommand{\dlim}{\displaystyle\lim\limits} \)
\( \newcommand{\id}{\mathrm{id}}\) \( \newcommand{\Span}{\mathrm{span}}\)
( \newcommand{\kernel}{\mathrm{null}\,}\) \( \newcommand{\range}{\mathrm{range}\,}\)
\( \newcommand{\RealPart}{\mathrm{Re}}\) \( \newcommand{\ImaginaryPart}{\mathrm{Im}}\)
\( \newcommand{\Argument}{\mathrm{Arg}}\) \( \newcommand{\norm}[1]{\| #1 \|}\)
\( \newcommand{\inner}[2]{\langle #1, #2 \rangle}\)
\( \newcommand{\Span}{\mathrm{span}}\)
\( \newcommand{\id}{\mathrm{id}}\)
\( \newcommand{\Span}{\mathrm{span}}\)
\( \newcommand{\kernel}{\mathrm{null}\,}\)
\( \newcommand{\range}{\mathrm{range}\,}\)
\( \newcommand{\RealPart}{\mathrm{Re}}\)
\( \newcommand{\ImaginaryPart}{\mathrm{Im}}\)
\( \newcommand{\Argument}{\mathrm{Arg}}\)
\( \newcommand{\norm}[1]{\| #1 \|}\)
\( \newcommand{\inner}[2]{\langle #1, #2 \rangle}\)
\( \newcommand{\Span}{\mathrm{span}}\) \( \newcommand{\AA}{\unicode[.8,0]{x212B}}\)
\( \newcommand{\vectorA}[1]{\vec{#1}} % arrow\)
\( \newcommand{\vectorAt}[1]{\vec{\text{#1}}} % arrow\)
\( \newcommand{\vectorB}[1]{\overset { \scriptstyle \rightharpoonup} {\mathbf{#1}} } \)
\( \newcommand{\vectorC}[1]{\textbf{#1}} \)
\( \newcommand{\vectorD}[1]{\overrightarrow{#1}} \)
\( \newcommand{\vectorDt}[1]{\overrightarrow{\text{#1}}} \)
\( \newcommand{\vectE}[1]{\overset{-\!-\!\rightharpoonup}{\vphantom{a}\smash{\mathbf {#1}}}} \)
\( \newcommand{\vecs}[1]{\overset { \scriptstyle \rightharpoonup} {\mathbf{#1}} } \)
\(\newcommand{\longvect}{\overrightarrow}\)
\( \newcommand{\vecd}[1]{\overset{-\!-\!\rightharpoonup}{\vphantom{a}\smash {#1}}} \)
\(\newcommand{\avec}{\mathbf a}\) \(\newcommand{\bvec}{\mathbf b}\) \(\newcommand{\cvec}{\mathbf c}\) \(\newcommand{\dvec}{\mathbf d}\) \(\newcommand{\dtil}{\widetilde{\mathbf d}}\) \(\newcommand{\evec}{\mathbf e}\) \(\newcommand{\fvec}{\mathbf f}\) \(\newcommand{\nvec}{\mathbf n}\) \(\newcommand{\pvec}{\mathbf p}\) \(\newcommand{\qvec}{\mathbf q}\) \(\newcommand{\svec}{\mathbf s}\) \(\newcommand{\tvec}{\mathbf t}\) \(\newcommand{\uvec}{\mathbf u}\) \(\newcommand{\vvec}{\mathbf v}\) \(\newcommand{\wvec}{\mathbf w}\) \(\newcommand{\xvec}{\mathbf x}\) \(\newcommand{\yvec}{\mathbf y}\) \(\newcommand{\zvec}{\mathbf z}\) \(\newcommand{\rvec}{\mathbf r}\) \(\newcommand{\mvec}{\mathbf m}\) \(\newcommand{\zerovec}{\mathbf 0}\) \(\newcommand{\onevec}{\mathbf 1}\) \(\newcommand{\real}{\mathbb R}\) \(\newcommand{\twovec}[2]{\left[\begin{array}{r}#1 \\ #2 \end{array}\right]}\) \(\newcommand{\ctwovec}[2]{\left[\begin{array}{c}#1 \\ #2 \end{array}\right]}\) \(\newcommand{\threevec}[3]{\left[\begin{array}{r}#1 \\ #2 \\ #3 \end{array}\right]}\) \(\newcommand{\cthreevec}[3]{\left[\begin{array}{c}#1 \\ #2 \\ #3 \end{array}\right]}\) \(\newcommand{\fourvec}[4]{\left[\begin{array}{r}#1 \\ #2 \\ #3 \\ #4 \end{array}\right]}\) \(\newcommand{\cfourvec}[4]{\left[\begin{array}{c}#1 \\ #2 \\ #3 \\ #4 \end{array}\right]}\) \(\newcommand{\fivevec}[5]{\left[\begin{array}{r}#1 \\ #2 \\ #3 \\ #4 \\ #5 \\ \end{array}\right]}\) \(\newcommand{\cfivevec}[5]{\left[\begin{array}{c}#1 \\ #2 \\ #3 \\ #4 \\ #5 \\ \end{array}\right]}\) \(\newcommand{\mattwo}[4]{\left[\begin{array}{rr}#1 \amp #2 \\ #3 \amp #4 \\ \end{array}\right]}\) \(\newcommand{\laspan}[1]{\text{Span}\{#1\}}\) \(\newcommand{\bcal}{\cal B}\) \(\newcommand{\ccal}{\cal C}\) \(\newcommand{\scal}{\cal S}\) \(\newcommand{\wcal}{\cal W}\) \(\newcommand{\ecal}{\cal E}\) \(\newcommand{\coords}[2]{\left\{#1\right\}_{#2}}\) \(\newcommand{\gray}[1]{\color{gray}{#1}}\) \(\newcommand{\lgray}[1]{\color{lightgray}{#1}}\) \(\newcommand{\rank}{\operatorname{rank}}\) \(\newcommand{\row}{\text{Row}}\) \(\newcommand{\col}{\text{Col}}\) \(\renewcommand{\row}{\text{Row}}\) \(\newcommand{\nul}{\text{Nul}}\) \(\newcommand{\var}{\text{Var}}\) \(\newcommand{\corr}{\text{corr}}\) \(\newcommand{\len}[1]{\left|#1\right|}\) \(\newcommand{\bbar}{\overline{\bvec}}\) \(\newcommand{\bhat}{\widehat{\bvec}}\) \(\newcommand{\bperp}{\bvec^\perp}\) \(\newcommand{\xhat}{\widehat{\xvec}}\) \(\newcommand{\vhat}{\widehat{\vvec}}\) \(\newcommand{\uhat}{\widehat{\uvec}}\) \(\newcommand{\what}{\widehat{\wvec}}\) \(\newcommand{\Sighat}{\widehat{\Sigma}}\) \(\newcommand{\lt}{<}\) \(\newcommand{\gt}{>}\) \(\newcommand{\amp}{&}\) \(\definecolor{fillinmathshade}{gray}{0.9}\)Name: ______________________________________________________
You are studying the growth of a hybrid species of Alaskan pine in three levels of soil moisture (wet, moderate, and dry) over a period of 30 days (0, 5, 10, 20, and 30). You want to determine if this species grows differently over time given different starting levels of soil moisture. Use the given data to test this claim (α = 0.05). If the interaction is significant, at what point does the difference in growth between the levels of soil moisture over time become significant? Use the factor plot and the Grouping information to specifically identify the difference in your conclusion.
|
Moisture |
Days |
Growth |
Moisture |
Days |
Growth |
Moisture |
Days |
Growth |
|---|---|---|---|---|---|---|---|---|
|
Dry |
0 |
7.78 |
Moderate |
0 |
10.926 |
Wet |
0 |
8.116 |
|
Dry |
0 |
8.09 |
Moderate |
0 |
9.162 |
Wet |
0 |
10.473 |
|
Dry |
0 |
7.27 |
Moderate |
0 |
7.83 |
Wet |
0 |
8.654 |
|
Dry |
0 |
11.35 |
Moderate |
0 |
8.604 |
Wet |
0 |
6.901 |
|
Dry |
0 |
11.94 |
Moderate |
0 |
9.324 |
Wet |
0 |
7.565 |
|
Dry |
0 |
10.89 |
Moderate |
0 |
6.462 |
Wet |
0 |
9.169 |
|
Dry |
5 |
7.152 |
Moderate |
5 |
8.456 |
Wet |
5 |
10.039 |
|
Dry |
5 |
9.117 |
Moderate |
5 |
11.012 |
Wet |
5 |
9.994 |
|
Dry |
5 |
7.671 |
Moderate |
5 |
7.541 |
Wet |
5 |
8.045 |
|
Dry |
5 |
10.823 |
Moderate |
5 |
9.482 |
Wet |
5 |
9.445 |
|
Dry |
5 |
12.309 |
Moderate |
5 |
9.473 |
Wet |
5 |
8.024 |
|
Dry |
5 |
9.756 |
Moderate |
5 |
10.2 |
Wet |
5 |
7.783 |
|
Dry |
10 |
9.096 |
Moderate |
10 |
8.582 |
Wet |
10 |
7.679 |
|
Dry |
10 |
5.864 |
Moderate |
10 |
9.934 |
Wet |
10 |
11.671 |
|
Dry |
10 |
9.445 |
Moderate |
10 |
9.279 |
Wet |
10 |
10.567 |
|
Dry |
10 |
7.136 |
Moderate |
10 |
6.651 |
Wet |
10 |
9.66 |
|
Dry |
10 |
6.869 |
Moderate |
10 |
10.546 |
Wet |
10 |
7.646 |
|
Dry |
10 |
8.716 |
Moderate |
10 |
7.927 |
Wet |
10 |
8.953 |
|
Dry |
20 |
4.716 |
Moderate |
20 |
2.903 |
Wet |
20 |
7.368 |
|
Dry |
20 |
3.528 |
Moderate |
20 |
4.91 |
Wet |
20 |
6.539 |
|
Dry |
20 |
4.964 |
Moderate |
20 |
4.998 |
Wet |
20 |
7.034 |
|
Dry |
20 |
5.004 |
Moderate |
20 |
4.954 |
Wet |
20 |
7.258 |
|
Dry |
20 |
3.824 |
Moderate |
20 |
3.279 |
Wet |
20 |
6.309 |
|
Dry |
20 |
4.356 |
Moderate |
20 |
3.528 |
Wet |
20 |
7.223 |
|
Dry |
30 |
1.053 |
Moderate |
30 |
0.748 |
Wet |
30 |
4.909 |
|
Dry |
30 |
1.287 |
Moderate |
30 |
0.997 |
Wet |
30 |
5.891 |
|
Dry |
30 |
1.11 |
Moderate |
30 |
0.7 |
Wet |
30 |
4.223 |
|
Dry |
30 |
0.832 |
Moderate |
30 |
1.018 |
Wet |
30 |
3.997 |
|
Dry |
30 |
1.082 |
Moderate |
30 |
1.007 |
Wet |
30 |
2.616 |
|
Dry |
30 |
1.095 |
Moderate |
30 |
1.083 |
Wet |
30 |
3.995 |
Open Minitab and enter the data into a spreadsheet. Select STAT>ANOVA>General Linear Model.
Click in the Response box and select GROWTH for the Response box, and enter MOISTURE, DAYS, and MOISTURE*DAYS (interaction term) in the Model box, as shown.
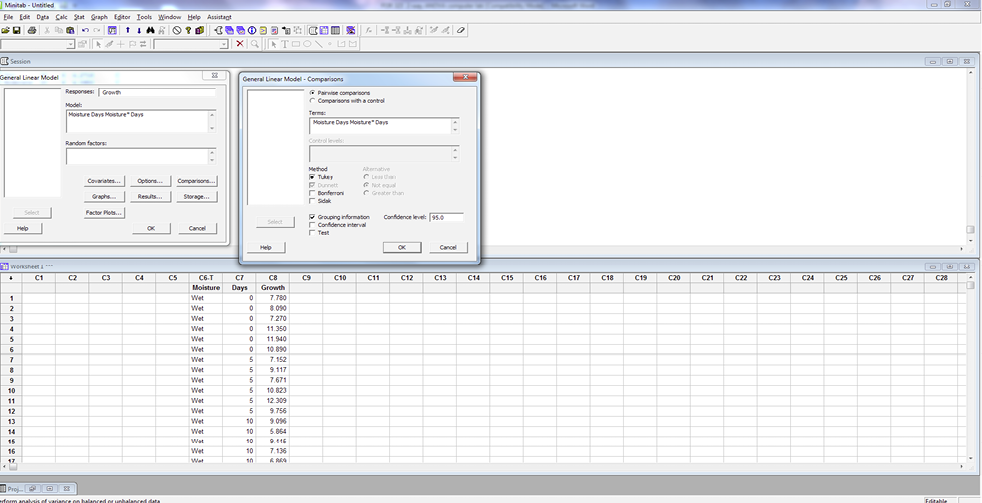
Under OPTIONS, select “Adjusted (Type III)” under Sums of Squares. Click OK.
Under COMPARISONS, select “Pairwise comparisons” using “Tukey” method and enter the two main effects and interaction (MOISTURE, DAYS, and MOISTURE*DAYS) in the terms box (click in the box first to select).
Check the Grouping Information box. Click OK.
Under RESULTS, select “Analysis of Variance Table” for Display of Results. Click OK.
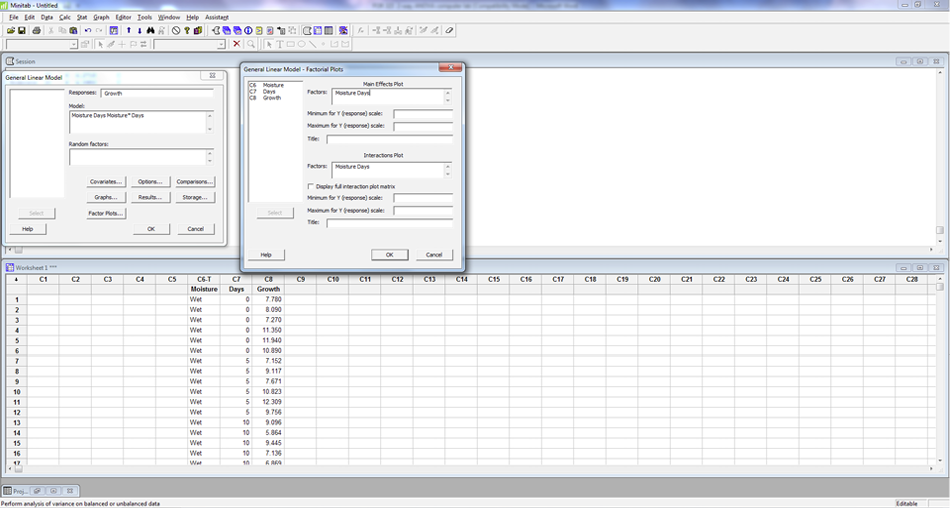
Under FACTOR PLOTS, enter MOISTURE and DAYS in both the main effects and interaction plot box. Click OK. Click OK.
Is the interaction term significant? __________________
Write the p-value ________________________________
Use the third Grouping Information Using Tukey Method (for the interaction) and the Factor plot to determine where the differences are for each treatment.
Attach a complete conclusion describing the differences in growth for this species over the 30 days for the 3 different levels of soil moisture.