1.4.2: Qualitative versus Quantitative Variables
- Page ID
- 17291
\( \newcommand{\vecs}[1]{\overset { \scriptstyle \rightharpoonup} {\mathbf{#1}} } \)
\( \newcommand{\vecd}[1]{\overset{-\!-\!\rightharpoonup}{\vphantom{a}\smash {#1}}} \)
\( \newcommand{\id}{\mathrm{id}}\) \( \newcommand{\Span}{\mathrm{span}}\)
( \newcommand{\kernel}{\mathrm{null}\,}\) \( \newcommand{\range}{\mathrm{range}\,}\)
\( \newcommand{\RealPart}{\mathrm{Re}}\) \( \newcommand{\ImaginaryPart}{\mathrm{Im}}\)
\( \newcommand{\Argument}{\mathrm{Arg}}\) \( \newcommand{\norm}[1]{\| #1 \|}\)
\( \newcommand{\inner}[2]{\langle #1, #2 \rangle}\)
\( \newcommand{\Span}{\mathrm{span}}\)
\( \newcommand{\id}{\mathrm{id}}\)
\( \newcommand{\Span}{\mathrm{span}}\)
\( \newcommand{\kernel}{\mathrm{null}\,}\)
\( \newcommand{\range}{\mathrm{range}\,}\)
\( \newcommand{\RealPart}{\mathrm{Re}}\)
\( \newcommand{\ImaginaryPart}{\mathrm{Im}}\)
\( \newcommand{\Argument}{\mathrm{Arg}}\)
\( \newcommand{\norm}[1]{\| #1 \|}\)
\( \newcommand{\inner}[2]{\langle #1, #2 \rangle}\)
\( \newcommand{\Span}{\mathrm{span}}\) \( \newcommand{\AA}{\unicode[.8,0]{x212B}}\)
\( \newcommand{\vectorA}[1]{\vec{#1}} % arrow\)
\( \newcommand{\vectorAt}[1]{\vec{\text{#1}}} % arrow\)
\( \newcommand{\vectorB}[1]{\overset { \scriptstyle \rightharpoonup} {\mathbf{#1}} } \)
\( \newcommand{\vectorC}[1]{\textbf{#1}} \)
\( \newcommand{\vectorD}[1]{\overrightarrow{#1}} \)
\( \newcommand{\vectorDt}[1]{\overrightarrow{\text{#1}}} \)
\( \newcommand{\vectE}[1]{\overset{-\!-\!\rightharpoonup}{\vphantom{a}\smash{\mathbf {#1}}}} \)
\( \newcommand{\vecs}[1]{\overset { \scriptstyle \rightharpoonup} {\mathbf{#1}} } \)
\( \newcommand{\vecd}[1]{\overset{-\!-\!\rightharpoonup}{\vphantom{a}\smash {#1}}} \)
\(\newcommand{\avec}{\mathbf a}\) \(\newcommand{\bvec}{\mathbf b}\) \(\newcommand{\cvec}{\mathbf c}\) \(\newcommand{\dvec}{\mathbf d}\) \(\newcommand{\dtil}{\widetilde{\mathbf d}}\) \(\newcommand{\evec}{\mathbf e}\) \(\newcommand{\fvec}{\mathbf f}\) \(\newcommand{\nvec}{\mathbf n}\) \(\newcommand{\pvec}{\mathbf p}\) \(\newcommand{\qvec}{\mathbf q}\) \(\newcommand{\svec}{\mathbf s}\) \(\newcommand{\tvec}{\mathbf t}\) \(\newcommand{\uvec}{\mathbf u}\) \(\newcommand{\vvec}{\mathbf v}\) \(\newcommand{\wvec}{\mathbf w}\) \(\newcommand{\xvec}{\mathbf x}\) \(\newcommand{\yvec}{\mathbf y}\) \(\newcommand{\zvec}{\mathbf z}\) \(\newcommand{\rvec}{\mathbf r}\) \(\newcommand{\mvec}{\mathbf m}\) \(\newcommand{\zerovec}{\mathbf 0}\) \(\newcommand{\onevec}{\mathbf 1}\) \(\newcommand{\real}{\mathbb R}\) \(\newcommand{\twovec}[2]{\left[\begin{array}{r}#1 \\ #2 \end{array}\right]}\) \(\newcommand{\ctwovec}[2]{\left[\begin{array}{c}#1 \\ #2 \end{array}\right]}\) \(\newcommand{\threevec}[3]{\left[\begin{array}{r}#1 \\ #2 \\ #3 \end{array}\right]}\) \(\newcommand{\cthreevec}[3]{\left[\begin{array}{c}#1 \\ #2 \\ #3 \end{array}\right]}\) \(\newcommand{\fourvec}[4]{\left[\begin{array}{r}#1 \\ #2 \\ #3 \\ #4 \end{array}\right]}\) \(\newcommand{\cfourvec}[4]{\left[\begin{array}{c}#1 \\ #2 \\ #3 \\ #4 \end{array}\right]}\) \(\newcommand{\fivevec}[5]{\left[\begin{array}{r}#1 \\ #2 \\ #3 \\ #4 \\ #5 \\ \end{array}\right]}\) \(\newcommand{\cfivevec}[5]{\left[\begin{array}{c}#1 \\ #2 \\ #3 \\ #4 \\ #5 \\ \end{array}\right]}\) \(\newcommand{\mattwo}[4]{\left[\begin{array}{rr}#1 \amp #2 \\ #3 \amp #4 \\ \end{array}\right]}\) \(\newcommand{\laspan}[1]{\text{Span}\{#1\}}\) \(\newcommand{\bcal}{\cal B}\) \(\newcommand{\ccal}{\cal C}\) \(\newcommand{\scal}{\cal S}\) \(\newcommand{\wcal}{\cal W}\) \(\newcommand{\ecal}{\cal E}\) \(\newcommand{\coords}[2]{\left\{#1\right\}_{#2}}\) \(\newcommand{\gray}[1]{\color{gray}{#1}}\) \(\newcommand{\lgray}[1]{\color{lightgray}{#1}}\) \(\newcommand{\rank}{\operatorname{rank}}\) \(\newcommand{\row}{\text{Row}}\) \(\newcommand{\col}{\text{Col}}\) \(\renewcommand{\row}{\text{Row}}\) \(\newcommand{\nul}{\text{Nul}}\) \(\newcommand{\var}{\text{Var}}\) \(\newcommand{\corr}{\text{corr}}\) \(\newcommand{\len}[1]{\left|#1\right|}\) \(\newcommand{\bbar}{\overline{\bvec}}\) \(\newcommand{\bhat}{\widehat{\bvec}}\) \(\newcommand{\bperp}{\bvec^\perp}\) \(\newcommand{\xhat}{\widehat{\xvec}}\) \(\newcommand{\vhat}{\widehat{\vvec}}\) \(\newcommand{\uhat}{\widehat{\uvec}}\) \(\newcommand{\what}{\widehat{\wvec}}\) \(\newcommand{\Sighat}{\widehat{\Sigma}}\) \(\newcommand{\lt}{<}\) \(\newcommand{\gt}{>}\) \(\newcommand{\amp}{&}\) \(\definecolor{fillinmathshade}{gray}{0.9}\)Some researchers call the first two scales of measurement (Ratio Scale and Interval Scale) “quantitative” because they measure things numerically, and call the last scale of measurement (Nominal Scale) “qualitative” because you count the number of things that have that quality. The MooMooMath YouTube series did a short segment on these two types of variables. [It turns out that there are a LOT of videos online about statistics! Use them any time you are confused! My only caution is that some videos use slightly different formulas than in this textbook, and some use software that will not be discussed here, so make sure that the information in the video matches what your professor is showing you.] Ordinal scales are sort of in-between these two types, but are more similar in statistical analyses to qualitative variables.
Quantitative Variables
Quantitative variables are measured with some sort of scale that uses numbers. For example, height can be measures in the number of inches for everyone. Halfway between 1 inch and two inches has a meaning. Anything that you can measure with a number and finding a mean makes sense is a quantitative variable. If a decimal makes sense, then the variable is quantitative.
Quantitative variables are usually continuous.
Example \(\PageIndex{1}\)
The data are the weights of backpacks with books in them. You sample the same five students. The weights (in pounds) of their backpacks are 6.2, 7, 6.8, 9.1, 4.3. Notice that backpacks carrying three books can have different weights. Is the weight of the backpacks a quantitative variable?
Solution
Yes, the weights are quantitative data because weight is a numerical variable that is measured.
Qualitative Variables
Qualitative variables, which are the nominal Scale of Measurement, have different values to represent different categories or kinds. Qualitative/nominal variables name or label different categories of objects. Something is either an apple or an orange, halfway between an apple and an orange doesn’t mean anything. Qualitative variables are counted, and the counts are used in statistical analyses.The name or label of a qualitative variable can be a number, but the number doesn’t mean anything.
Exercise \(\PageIndex{1}\)
Let’s say I collected data and coded it:
- Women = 1
- Men = 2,
- Non-binary = 3
Does it make any sense to add these numbers? To find the “mean” of gender?
- Answer
-
No. An average gender of 1.75 (or whatever) doesn't tell us much since gender is a qualitative variable (nominal scale of measurement), so you can only count it.
Qualitative variables are discrete.
Deciding: Quant or Qual?
Use the following to practice identifying whether variables are quantitative (measured with numbers) or qualitative (categories).
Exercise \(\PageIndex{2}\)
- City
- Gender
- Weight
- Type of degree
- College major
- Percent correct on Exam 1.
- Score on a depression scale (between 0 and 10)
- How long it takes you to blink after a puff of air hits your eye.
- What is another example of a quantitative variable?
- What is another example of a qualitative variable?
- Answer
-
- City: Qualitative (named, not measured)
- Gender: Qualitative (named, not measured)
- Weight: Quantitative (number measured in ounces, pounds, tons, etc.; decimal points make sense)
- Type of degree: Qualitative (named, not measured)
- College major: Qualitative (named, not measured)
- Percent correct on Exam 1: Quantitative (number measured in percentage points; decimal points make sense)
- Score on a depression scale (between 0 and 10): Quantitative (number measured by the scale; decimal points make sense)
- How long it takes you to blink after a puff of air hits your eye: Quantitative (number measured in milliseconds; decimal points make sense)
- What is another example of a quantitative variable? (Your answer should be something that was measured, not counted, and in which decimal points make sense.)
- What is another example of a qualitative variable? (Your answer should be something that is a category or name.)
Okay, that probably makes it seem like it's easy to know whether your variable is qualitative or quantitative.
Exercise \(\PageIndex{3}\) shows that variables can be defined in different ways.
Exercise \(\PageIndex{3}\)
You go to the supermarket and purchase three cans of soup (19 ounces) tomato bisque, 14.1 ounces lentil, and 19 ounces Italian wedding), two packages of nuts (walnuts and peanuts), four different kinds of vegetable (broccoli, cauliflower, spinach, and carrots), and two desserts (16 ounces Cherry Garcia ice cream and two pounds (32 ounces chocolate chip cookies).
Name data sets that are quantitative discrete, quantitative continuous, and qualitative.
Solution
One Possible Solution:
- The three cans of soup, two packages of nuts, four kinds of vegetables and two desserts are quantitative discrete data because you count them.
- The weights of the soups (19 ounces, 14.1 ounces, 19 ounces) are quantitative continuous data because you measure weights as precisely as possible.
- Types of soups, nuts, vegetables and desserts are qualitative data because they are categorical.
Try to identify additional data sets in this example.
As you'll learn in the next chapter, there are types of graphs that are designed for qualitative variables and other graphs that are most appropriate for quantitative variables. Before you learn about that, why don't you check out these graphs to see if you can figure out whether the variable is qualitative or quantitative.
Exercise \(\PageIndex{6}\)
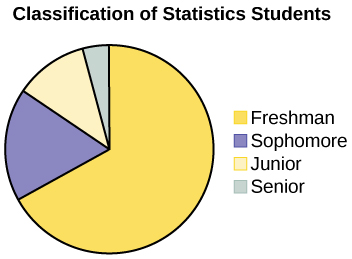
A statistics professor collects information about the classification of her students as freshmen, sophomores, juniors, or seniors. The data she collects are summarized in the pie chart Figure \(\PageIndex{1}\). What type of data does this graph show?

Figure \(\PageIndex{1}\)- Statistics Students (CC-BY by Barbara Illowsky & Susan Dean (De Anza College) from OpenStax)
- Answer
-
This pie chart shows the students in each year, which is qualitative data.
Exercise \(\PageIndex{7}\)
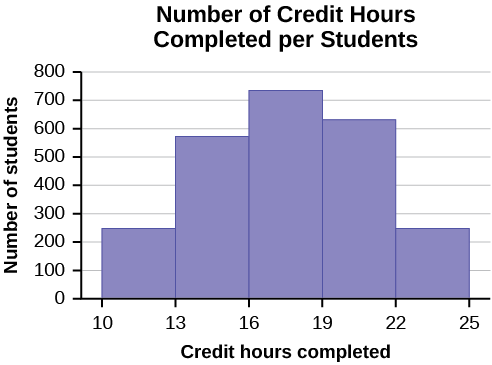
The Registrar keeps records of the number of credit hours students complete each semester. The data she collects are summarized in the histogram.

Figure \(\PageIndex{2}\)- Credit Hours (CC-BY by Barbara Illowsky & Susan Dean (De Anza College) from OpenStax)
What type of data does this graph show?
- Answer
-
A histogram is used to display quantitative data: the numbers of credit hours completed.
Final Word on Scales of Measurement
The type of scale determines what specific statistical analysis you should use. Unfortunately, statistical software will run what you ask, regardless of the measurement scale of the variable. If it’s a number, you can analyze it. When this happens with qualitative variables, the results are junk. If you say apple=1 and orange=2, it will find the average of an appleorange.
Contributors and Attributions
This page was extensively adapted by Michelle Oja (Taft College) from work by Barbara Illowsky & Susan Dean (De Anza College) from OpenStax.


