
Section 8.4: EFA Determining the Number of Factors
- Page ID
- 31607
\( \newcommand{\vecs}[1]{\overset { \scriptstyle \rightharpoonup} {\mathbf{#1}} } \)
\( \newcommand{\vecd}[1]{\overset{-\!-\!\rightharpoonup}{\vphantom{a}\smash {#1}}} \)
\( \newcommand{\id}{\mathrm{id}}\) \( \newcommand{\Span}{\mathrm{span}}\)
( \newcommand{\kernel}{\mathrm{null}\,}\) \( \newcommand{\range}{\mathrm{range}\,}\)
\( \newcommand{\RealPart}{\mathrm{Re}}\) \( \newcommand{\ImaginaryPart}{\mathrm{Im}}\)
\( \newcommand{\Argument}{\mathrm{Arg}}\) \( \newcommand{\norm}[1]{\| #1 \|}\)
\( \newcommand{\inner}[2]{\langle #1, #2 \rangle}\)
\( \newcommand{\Span}{\mathrm{span}}\)
\( \newcommand{\id}{\mathrm{id}}\)
\( \newcommand{\Span}{\mathrm{span}}\)
\( \newcommand{\kernel}{\mathrm{null}\,}\)
\( \newcommand{\range}{\mathrm{range}\,}\)
\( \newcommand{\RealPart}{\mathrm{Re}}\)
\( \newcommand{\ImaginaryPart}{\mathrm{Im}}\)
\( \newcommand{\Argument}{\mathrm{Arg}}\)
\( \newcommand{\norm}[1]{\| #1 \|}\)
\( \newcommand{\inner}[2]{\langle #1, #2 \rangle}\)
\( \newcommand{\Span}{\mathrm{span}}\) \( \newcommand{\AA}{\unicode[.8,0]{x212B}}\)
\( \newcommand{\vectorA}[1]{\vec{#1}} % arrow\)
\( \newcommand{\vectorAt}[1]{\vec{\text{#1}}} % arrow\)
\( \newcommand{\vectorB}[1]{\overset { \scriptstyle \rightharpoonup} {\mathbf{#1}} } \)
\( \newcommand{\vectorC}[1]{\textbf{#1}} \)
\( \newcommand{\vectorD}[1]{\overrightarrow{#1}} \)
\( \newcommand{\vectorDt}[1]{\overrightarrow{\text{#1}}} \)
\( \newcommand{\vectE}[1]{\overset{-\!-\!\rightharpoonup}{\vphantom{a}\smash{\mathbf {#1}}}} \)
\( \newcommand{\vecs}[1]{\overset { \scriptstyle \rightharpoonup} {\mathbf{#1}} } \)
\( \newcommand{\vecd}[1]{\overset{-\!-\!\rightharpoonup}{\vphantom{a}\smash {#1}}} \)
Learning Objectives
At the end of this section you should be able to answer the following questions:
- How do you determine the number of factors suggested by a Scree Plot?
- What is Kaiser’s rule for eigenvalues?
PowerPoint: Communalties Scree Plots and Number of Factors
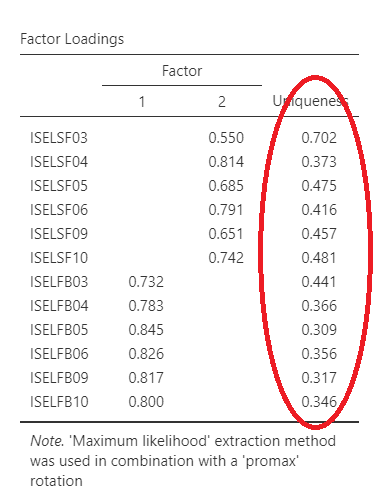
Please have a look at the SPSS Output below for Communalities:
Here is the communalities table from Jamovi. It is recommended that you reproduce this in your write-up.
Number of Factors
Determining the number of factors measured by the items used can often be more of a judgment call than a simple yes or no. The number of factors can be determined using two things in the results: Scree plot, by using visual examination, and Kaiser’s rule, which requires eigenvalues of greater than 1. Kaiser’s rule is a useful indicator but needs to be supplemented with other types of information like the Scree Plot.
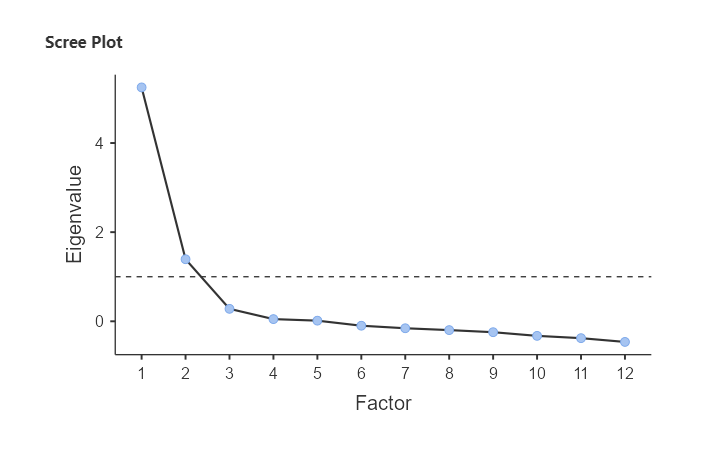
Scree Plot
Using the scree plot, you look for the point at which the line graph begins to ‘flatten’, and that will tell the number of factors present. “Flatness” on a curve can be usually defined as the portion of the curve following the last, large drop. You choose the point before the last, large drop on the Scree Plot to indicate the number of factors. As can be seen here, the line flattens at about 3, indicating that there are two major factors.
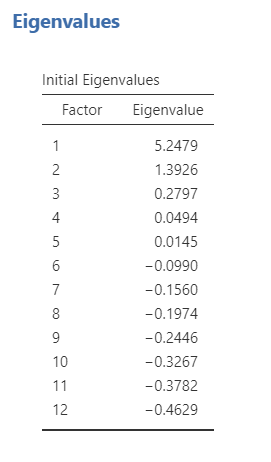
Eigenvalues
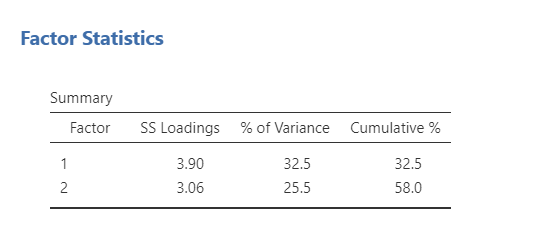
The finding of the scree plot is supported by the eigenvalues. The number of factors with eigenvalues greater than 1 is two. This explains 67.71% of the variance of the data.