
Section 7.3: Moderation Models, Assumptions, Interpretation, and Write Up
- Page ID
- 31601
\( \newcommand{\vecs}[1]{\overset { \scriptstyle \rightharpoonup} {\mathbf{#1}} } \)
\( \newcommand{\vecd}[1]{\overset{-\!-\!\rightharpoonup}{\vphantom{a}\smash {#1}}} \)
\( \newcommand{\id}{\mathrm{id}}\) \( \newcommand{\Span}{\mathrm{span}}\)
( \newcommand{\kernel}{\mathrm{null}\,}\) \( \newcommand{\range}{\mathrm{range}\,}\)
\( \newcommand{\RealPart}{\mathrm{Re}}\) \( \newcommand{\ImaginaryPart}{\mathrm{Im}}\)
\( \newcommand{\Argument}{\mathrm{Arg}}\) \( \newcommand{\norm}[1]{\| #1 \|}\)
\( \newcommand{\inner}[2]{\langle #1, #2 \rangle}\)
\( \newcommand{\Span}{\mathrm{span}}\)
\( \newcommand{\id}{\mathrm{id}}\)
\( \newcommand{\Span}{\mathrm{span}}\)
\( \newcommand{\kernel}{\mathrm{null}\,}\)
\( \newcommand{\range}{\mathrm{range}\,}\)
\( \newcommand{\RealPart}{\mathrm{Re}}\)
\( \newcommand{\ImaginaryPart}{\mathrm{Im}}\)
\( \newcommand{\Argument}{\mathrm{Arg}}\)
\( \newcommand{\norm}[1]{\| #1 \|}\)
\( \newcommand{\inner}[2]{\langle #1, #2 \rangle}\)
\( \newcommand{\Span}{\mathrm{span}}\) \( \newcommand{\AA}{\unicode[.8,0]{x212B}}\)
\( \newcommand{\vectorA}[1]{\vec{#1}} % arrow\)
\( \newcommand{\vectorAt}[1]{\vec{\text{#1}}} % arrow\)
\( \newcommand{\vectorB}[1]{\overset { \scriptstyle \rightharpoonup} {\mathbf{#1}} } \)
\( \newcommand{\vectorC}[1]{\textbf{#1}} \)
\( \newcommand{\vectorD}[1]{\overrightarrow{#1}} \)
\( \newcommand{\vectorDt}[1]{\overrightarrow{\text{#1}}} \)
\( \newcommand{\vectE}[1]{\overset{-\!-\!\rightharpoonup}{\vphantom{a}\smash{\mathbf {#1}}}} \)
\( \newcommand{\vecs}[1]{\overset { \scriptstyle \rightharpoonup} {\mathbf{#1}} } \)
\( \newcommand{\vecd}[1]{\overset{-\!-\!\rightharpoonup}{\vphantom{a}\smash {#1}}} \)
Learning Objectives
At the end of this section you should be able to answer the following questions:
- What are some basic assumptions behind moderation?
- What are the key components of a write up of moderation analysis?
Moderation Models
Difference between Mediation & Moderation
The main difference between a simple interaction, like in ANOVA models or in moderation models, is that mediation implies that there is a causal sequence. In this case, we know that stress causes ill effects on health, so that would be the causal factor.
Some predictor variables interact in a sequence, rather than impacting the outcome variable singly or as a group (like regression).
Moderation and mediation is a form of regression that allows researchers to analyse how a third variable effects the relationship of the predictor and outcome variable.
Moderation analyses imply an interaction on the different levels of M
PowerPoint: Basic Moderation Model
Consider the below model:
Would the muscle percentage be the same for young, middle-aged, and older participants after training? We know that it is harder to build muscle as we age, so would training have a lower effect on muscle growth in older people?
Example Research Question:
Does cyberbullying moderate the relationship between perceived stress and mental distress?
Moderation Assumptions
- The dependent and independent variables should be measured on a continuous scale.
- There should be a moderator variable that is a nominal variable with at least two groups.
- The variables of interest (the dependent variable and the independent and moderator variables) should have a linear relationship, which you can check with a scatterplot.
- The data must not show multicollinearity (see Multiple Regression).
- There should be no significant outliers, and the distribution of the variables should be approximately normal.
Moderation Interpretation
PowerPoint: Moderation menu, results and output
Please have a look at the following link for the Moderation Menu and Output:

Interpretation
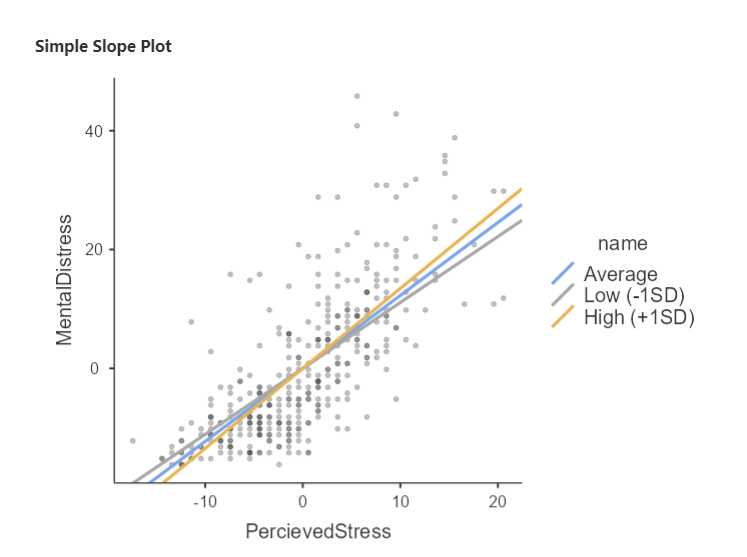
The effects of cyberbullying can be seen in blue, with the perceived stress in green. These are the main effects of the X and M variable on the outcome variable (Y). The interaction effect can be seen in purple. This will tell us if perceived stress is effecting mental distress equally for average, lower than average or higher than average levels of cyberbullying. If this is significant, then there is a difference in that effect. As can be seen in yellow and grey, cyberbullying has an effect on mental distress, but the effect is stronger for those who report higher levels of cyberbullying (see graph).
Moderation Write Up
The following text represents a moderation write up:
A moderation test was run, with perceived stress as the predictor, mental distress as the dependant, and cyberbullying as a moderator. There was a significant main effect found between perceived stress and mental distress, b= -1.23, BCa CI [1.11, 1.34], z=21.38, p <.001, and nonsignificant main effect of cyberbullying on mental distress b= 1.05, BCa CI [0.72, 1.38], z=6.28, p <.001. There was a significant interaction found by cyberbullying on perceived stress and mental distress, b= -0.05, BCa CI [0.01, 0.09], z=2.16, p =.031. It was found that participants who reported higher than average levels of cyberbullying experienced a greater effect of perceived stress on mental distress (b= 1.35, BCa CI [1.19, 1.50], z=17.1, p <.001), when compared to average or lower than average levels of cyberbullying (b= 1.23, BCa CI [1.11, 1.34], z=21.3, p <.001, b= 1.11, BCa CI [0.95, 1.27], z=13.8, p <.001, respectively). From these results, it can be concluded that the effect of perceived stress on mental distress is partially moderated by cyberbullying.