
11.3: ANOVA Hypothesis Testing
- Page ID
- 29626
\( \newcommand{\vecs}[1]{\overset { \scriptstyle \rightharpoonup} {\mathbf{#1}} } \)
\( \newcommand{\vecd}[1]{\overset{-\!-\!\rightharpoonup}{\vphantom{a}\smash {#1}}} \)
\( \newcommand{\dsum}{\displaystyle\sum\limits} \)
\( \newcommand{\dint}{\displaystyle\int\limits} \)
\( \newcommand{\dlim}{\displaystyle\lim\limits} \)
\( \newcommand{\id}{\mathrm{id}}\) \( \newcommand{\Span}{\mathrm{span}}\)
( \newcommand{\kernel}{\mathrm{null}\,}\) \( \newcommand{\range}{\mathrm{range}\,}\)
\( \newcommand{\RealPart}{\mathrm{Re}}\) \( \newcommand{\ImaginaryPart}{\mathrm{Im}}\)
\( \newcommand{\Argument}{\mathrm{Arg}}\) \( \newcommand{\norm}[1]{\| #1 \|}\)
\( \newcommand{\inner}[2]{\langle #1, #2 \rangle}\)
\( \newcommand{\Span}{\mathrm{span}}\)
\( \newcommand{\id}{\mathrm{id}}\)
\( \newcommand{\Span}{\mathrm{span}}\)
\( \newcommand{\kernel}{\mathrm{null}\,}\)
\( \newcommand{\range}{\mathrm{range}\,}\)
\( \newcommand{\RealPart}{\mathrm{Re}}\)
\( \newcommand{\ImaginaryPart}{\mathrm{Im}}\)
\( \newcommand{\Argument}{\mathrm{Arg}}\)
\( \newcommand{\norm}[1]{\| #1 \|}\)
\( \newcommand{\inner}[2]{\langle #1, #2 \rangle}\)
\( \newcommand{\Span}{\mathrm{span}}\) \( \newcommand{\AA}{\unicode[.8,0]{x212B}}\)
\( \newcommand{\vectorA}[1]{\vec{#1}} % arrow\)
\( \newcommand{\vectorAt}[1]{\vec{\text{#1}}} % arrow\)
\( \newcommand{\vectorB}[1]{\overset { \scriptstyle \rightharpoonup} {\mathbf{#1}} } \)
\( \newcommand{\vectorC}[1]{\textbf{#1}} \)
\( \newcommand{\vectorD}[1]{\overrightarrow{#1}} \)
\( \newcommand{\vectorDt}[1]{\overrightarrow{\text{#1}}} \)
\( \newcommand{\vectE}[1]{\overset{-\!-\!\rightharpoonup}{\vphantom{a}\smash{\mathbf {#1}}}} \)
\( \newcommand{\vecs}[1]{\overset { \scriptstyle \rightharpoonup} {\mathbf{#1}} } \)
\(\newcommand{\longvect}{\overrightarrow}\)
\( \newcommand{\vecd}[1]{\overset{-\!-\!\rightharpoonup}{\vphantom{a}\smash {#1}}} \)
\(\newcommand{\avec}{\mathbf a}\) \(\newcommand{\bvec}{\mathbf b}\) \(\newcommand{\cvec}{\mathbf c}\) \(\newcommand{\dvec}{\mathbf d}\) \(\newcommand{\dtil}{\widetilde{\mathbf d}}\) \(\newcommand{\evec}{\mathbf e}\) \(\newcommand{\fvec}{\mathbf f}\) \(\newcommand{\nvec}{\mathbf n}\) \(\newcommand{\pvec}{\mathbf p}\) \(\newcommand{\qvec}{\mathbf q}\) \(\newcommand{\svec}{\mathbf s}\) \(\newcommand{\tvec}{\mathbf t}\) \(\newcommand{\uvec}{\mathbf u}\) \(\newcommand{\vvec}{\mathbf v}\) \(\newcommand{\wvec}{\mathbf w}\) \(\newcommand{\xvec}{\mathbf x}\) \(\newcommand{\yvec}{\mathbf y}\) \(\newcommand{\zvec}{\mathbf z}\) \(\newcommand{\rvec}{\mathbf r}\) \(\newcommand{\mvec}{\mathbf m}\) \(\newcommand{\zerovec}{\mathbf 0}\) \(\newcommand{\onevec}{\mathbf 1}\) \(\newcommand{\real}{\mathbb R}\) \(\newcommand{\twovec}[2]{\left[\begin{array}{r}#1 \\ #2 \end{array}\right]}\) \(\newcommand{\ctwovec}[2]{\left[\begin{array}{c}#1 \\ #2 \end{array}\right]}\) \(\newcommand{\threevec}[3]{\left[\begin{array}{r}#1 \\ #2 \\ #3 \end{array}\right]}\) \(\newcommand{\cthreevec}[3]{\left[\begin{array}{c}#1 \\ #2 \\ #3 \end{array}\right]}\) \(\newcommand{\fourvec}[4]{\left[\begin{array}{r}#1 \\ #2 \\ #3 \\ #4 \end{array}\right]}\) \(\newcommand{\cfourvec}[4]{\left[\begin{array}{c}#1 \\ #2 \\ #3 \\ #4 \end{array}\right]}\) \(\newcommand{\fivevec}[5]{\left[\begin{array}{r}#1 \\ #2 \\ #3 \\ #4 \\ #5 \\ \end{array}\right]}\) \(\newcommand{\cfivevec}[5]{\left[\begin{array}{c}#1 \\ #2 \\ #3 \\ #4 \\ #5 \\ \end{array}\right]}\) \(\newcommand{\mattwo}[4]{\left[\begin{array}{rr}#1 \amp #2 \\ #3 \amp #4 \\ \end{array}\right]}\) \(\newcommand{\laspan}[1]{\text{Span}\{#1\}}\) \(\newcommand{\bcal}{\cal B}\) \(\newcommand{\ccal}{\cal C}\) \(\newcommand{\scal}{\cal S}\) \(\newcommand{\wcal}{\cal W}\) \(\newcommand{\ecal}{\cal E}\) \(\newcommand{\coords}[2]{\left\{#1\right\}_{#2}}\) \(\newcommand{\gray}[1]{\color{gray}{#1}}\) \(\newcommand{\lgray}[1]{\color{lightgray}{#1}}\) \(\newcommand{\rank}{\operatorname{rank}}\) \(\newcommand{\row}{\text{Row}}\) \(\newcommand{\col}{\text{Col}}\) \(\renewcommand{\row}{\text{Row}}\) \(\newcommand{\nul}{\text{Nul}}\) \(\newcommand{\var}{\text{Var}}\) \(\newcommand{\corr}{\text{corr}}\) \(\newcommand{\len}[1]{\left|#1\right|}\) \(\newcommand{\bbar}{\overline{\bvec}}\) \(\newcommand{\bhat}{\widehat{\bvec}}\) \(\newcommand{\bperp}{\bvec^\perp}\) \(\newcommand{\xhat}{\widehat{\xvec}}\) \(\newcommand{\vhat}{\widehat{\vvec}}\) \(\newcommand{\uhat}{\widehat{\uvec}}\) \(\newcommand{\what}{\widehat{\wvec}}\) \(\newcommand{\Sighat}{\widehat{\Sigma}}\) \(\newcommand{\lt}{<}\) \(\newcommand{\gt}{>}\) \(\newcommand{\amp}{&}\) \(\definecolor{fillinmathshade}{gray}{0.9}\)45
ANOVA Hypothesis Testing
jkesler
Here are some facts about the F distribution.
- The curve is not symmetrical but skewed to the right.
- There is a different curve for each set of df s.
- The F statistic is greater than or equal to zero.
- As the degrees of freedom for the numerator and for the denominator get larger, the curve approximates the normal.
- Other uses for the F distribution include comparing two variances and two-way Analysis of Variance. Two-Way Analysis is beyond the scope of this chapter.
Example 11.2
Let’s return to the slicing tomato exercise in Try It. The means of the tomato yields under the five mulching conditions are represented by μ1, μ2, μ3, μ4, μ5. We will conduct a hypothesis test to determine if all means are the same or at least one is different. Using a significance level of 5%, test the null hypothesis that there is no difference in mean yields among the five groups against the alternative hypothesis that at least one mean is different from the rest.
Try It 11.2
MRSA, or Staphylococcus aureus, can cause a serious bacterial infections in hospital patients. Table 11.6 shows various colony counts from different patients who may or may not have MRSA. The data from the table is plotted in Figure 11.5.
| Conc = 0.6 | Conc = 0.8 | Conc = 1.0 | Conc = 1.2 | Conc = 1.4 |
|---|---|---|---|---|
| 9 | 16 | 22 | 30 | 27 |
| 66 | 93 | 147 | 199 | 168 |
| 98 | 82 | 120 | 148 | 132 |
Plot of the data for the different concentrations:
Test whether the mean number of colonies are the same or are different. Construct the ANOVA table, find the p-value, and state your conclusion. Use a 5% significance level.
Example 11.3
Four sororities took a random sample of sisters regarding their grade means for the past term. The results are shown in Table 11.7.
| Sorority 1 | Sorority 2 | Sorority 3 | Sorority 4 |
|---|---|---|---|
| 2.17 | 2.63 | 2.63 | 3.79 |
| 1.85 | 1.77 | 3.78 | 3.45 |
| 2.83 | 3.25 | 4.00 | 3.08 |
| 1.69 | 1.86 | 2.55 | 2.26 |
| 3.33 | 2.21 | 2.45 | 3.18 |
Using a significance level of 1%, is there a difference in mean grades among the
sororities?
Solution 11.3
Let μ1, μ2, μ3, μ4 be the population means of the sororities. Remember that the null hypothesis claims that the sorority groups are from the same normal distribution. The alternate hypothesis says that at least two of the sorority groups come from populations with different normal distributions. Notice that the four sample sizes are each five.
Note
This is an example of a balanced design, because each factor (i.e., sorority) has the same number of observations.
H0: μ1 = μ2 = μ3 = μ4
H1: Not all of the means μ1, μ2, μ3, μ4 are equal.
Distribution for the test:F3,16
where k = 4 groups and n = 20 samples in total
df(num)= k – 1 = 4 – 1 = 3
df(denom) = n – k = 20 – 4 = 16
Calculate the test statistic:F = 2.23
Graph:
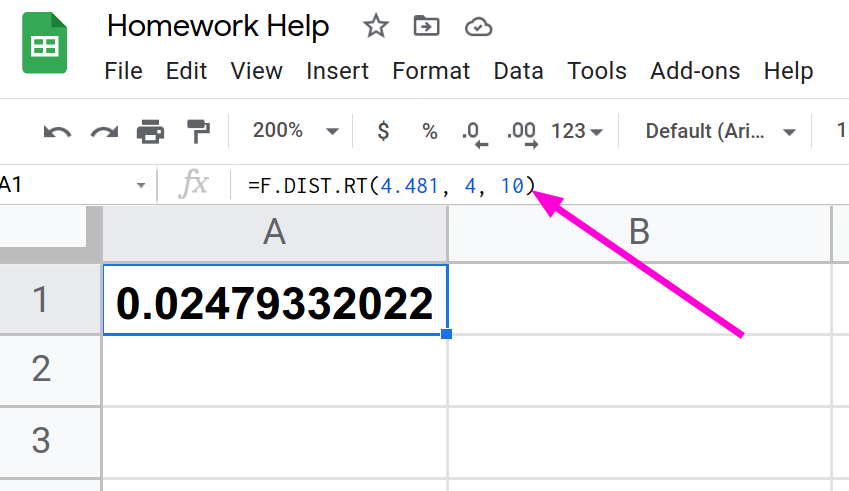
Probability statement:p-value = P(F > 2.23) = 0.1241 (find p-values using a spreadsheet like example 11.2)
Compare α and the p-value:α = 0.01
p-value = 0.1241
α < p-value
Make a decision: Since α < p-value, you cannot reject H0.
Conclusion: There is not sufficient evidence to conclude that there is a difference among the mean grades for the sororities.
Try It 11.3
Four sports teams took a random sample of players regarding their GPAs for the last year. The results are shown in Table 11.8.
| Basketball | Baseball | Hockey | Lacrosse |
|---|---|---|---|
| 3.6 | 2.1 | 4.0 | 2.0 |
| 2.9 | 2.6 | 2.0 | 3.6 |
| 2.5 | 3.9 | 2.6 | 3.9 |
| 3.3 | 3.1 | 3.2 | 2.7 |
| 3.8 | 3.4 | 3.2 | 2.5 |
Use a significance level of 5%, and determine if there is a difference in GPA among the teams.
Example 11.4
A fourth grade class is studying the environment. One of the assignments is to grow bean plants in different soils. Tommy chose to grow his bean plants in soil found outside his classroom mixed with dryer lint. Tara chose to grow her bean plants in potting soil bought at the local nursery. Nick chose to grow his bean plants in soil from his mother’s garden. No chemicals were used on the plants, only water. They were grown inside the classroom next to a large window. Each child grew five plants. At the end of the growing period, each plant was measured, producing the data (in inches) in Table 11.9.
| Tommy’s Plants | Tara’s Plants | Nick’s Plants |
|---|---|---|
| 24 | 25 | 23 |
| 21 | 31 | 27 |
| 23 | 23 | 22 |
| 30 | 20 | 30 |
| 23 | 28 | 20 |
Does it appear that the three media in which the bean plants were grown produce the same mean height? Test at a 3% level of significance.
Solution 11.4
This time, we will perform the calculations that lead to the $F^\prime$ statistic. Notice that each group has the same number of plants, so we will use the formula $F^\prime = \frac{n\cdot s_{\bar x}^2}{s_\text{pooled}^2}$
First, calculate the sample mean and sample variance of each group.
| Tommy’s Plants | Tara’s Plants | Nick’s Plants | |
|---|---|---|---|
| Sample Mean | 24.2 | 25.4 | 24.4 |
| Sample Variance | 11.7 | 18.3 | 16.3 |
Next, calculate the variance of the three group means (Calculate the variance of 24.2, 25.4, and 24.4). Variance of the group means = $s_\bar{x}^2 = 0.413$
Then MSbetween = $n\cdot s_\bar{x}^2 = (5)(0.413)$ where n = 5 is the sample size (number of plants each child grew).
Calculate the mean of the three sample variances (Calculate the mean of 11.7, 18.3, and 16.3). Mean of the sample variances = 15.433 = s2pooled
Then MSwithin = s2pooled = 15.433.
The F statistic (or F ratio) is $F=\frac{MS_\text{between}}{MS_\text{within}}=\frac{n\cdot s_\bar{x}^2}{s_\text{pooled}^2}=\frac{(5)(0.413)}{15.433}=0.134$
The dfs for the numerator = the number of groups – 1 = 3 – 1 = 2.
The dfs for the denominator = the total number of samples – the number of groups = 15 – 3 = 12
The distribution for the test is F2,12 and the F statistic is F = 0.134
The p-value is P(F > 0.134) = 0.8759. (find p-values using a spreadsheet like example 11.2)
Decision: Since α = 0.03 and the p-value = 0.8759, do not reject H0.
Conclusion: With a 3% level of significance, from the sample data, the evidence is not sufficient to conclude that the mean heights of the bean plants are different.
Try It 11.4
Another fourth grader also grew bean plants, but this time in a jelly-like mass. The heights were (in inches) 24, 28, 25, 30, and 32. Do a one-way ANOVA test on the four groups. Are the heights of the bean plants different? Use the same method as shown in Example 11.4.