
2.7.2.4: Interpreting Interactions- Do Main Effects Matter?
- Page ID
- 22135

\( \newcommand{\vecs}[1]{\overset { \scriptstyle \rightharpoonup} {\mathbf{#1}} } \)
\( \newcommand{\vecd}[1]{\overset{-\!-\!\rightharpoonup}{\vphantom{a}\smash {#1}}} \)
\( \newcommand{\id}{\mathrm{id}}\) \( \newcommand{\Span}{\mathrm{span}}\)
( \newcommand{\kernel}{\mathrm{null}\,}\) \( \newcommand{\range}{\mathrm{range}\,}\)
\( \newcommand{\RealPart}{\mathrm{Re}}\) \( \newcommand{\ImaginaryPart}{\mathrm{Im}}\)
\( \newcommand{\Argument}{\mathrm{Arg}}\) \( \newcommand{\norm}[1]{\| #1 \|}\)
\( \newcommand{\inner}[2]{\langle #1, #2 \rangle}\)
\( \newcommand{\Span}{\mathrm{span}}\)
\( \newcommand{\id}{\mathrm{id}}\)
\( \newcommand{\Span}{\mathrm{span}}\)
\( \newcommand{\kernel}{\mathrm{null}\,}\)
\( \newcommand{\range}{\mathrm{range}\,}\)
\( \newcommand{\RealPart}{\mathrm{Re}}\)
\( \newcommand{\ImaginaryPart}{\mathrm{Im}}\)
\( \newcommand{\Argument}{\mathrm{Arg}}\)
\( \newcommand{\norm}[1]{\| #1 \|}\)
\( \newcommand{\inner}[2]{\langle #1, #2 \rangle}\)
\( \newcommand{\Span}{\mathrm{span}}\) \( \newcommand{\AA}{\unicode[.8,0]{x212B}}\)
\( \newcommand{\vectorA}[1]{\vec{#1}} % arrow\)
\( \newcommand{\vectorAt}[1]{\vec{\text{#1}}} % arrow\)
\( \newcommand{\vectorB}[1]{\overset { \scriptstyle \rightharpoonup} {\mathbf{#1}} } \)
\( \newcommand{\vectorC}[1]{\textbf{#1}} \)
\( \newcommand{\vectorD}[1]{\overrightarrow{#1}} \)
\( \newcommand{\vectorDt}[1]{\overrightarrow{\text{#1}}} \)
\( \newcommand{\vectE}[1]{\overset{-\!-\!\rightharpoonup}{\vphantom{a}\smash{\mathbf {#1}}}} \)
\( \newcommand{\vecs}[1]{\overset { \scriptstyle \rightharpoonup} {\mathbf{#1}} } \)
\( \newcommand{\vecd}[1]{\overset{-\!-\!\rightharpoonup}{\vphantom{a}\smash {#1}}} \)
\(\newcommand{\avec}{\mathbf a}\) \(\newcommand{\bvec}{\mathbf b}\) \(\newcommand{\cvec}{\mathbf c}\) \(\newcommand{\dvec}{\mathbf d}\) \(\newcommand{\dtil}{\widetilde{\mathbf d}}\) \(\newcommand{\evec}{\mathbf e}\) \(\newcommand{\fvec}{\mathbf f}\) \(\newcommand{\nvec}{\mathbf n}\) \(\newcommand{\pvec}{\mathbf p}\) \(\newcommand{\qvec}{\mathbf q}\) \(\newcommand{\svec}{\mathbf s}\) \(\newcommand{\tvec}{\mathbf t}\) \(\newcommand{\uvec}{\mathbf u}\) \(\newcommand{\vvec}{\mathbf v}\) \(\newcommand{\wvec}{\mathbf w}\) \(\newcommand{\xvec}{\mathbf x}\) \(\newcommand{\yvec}{\mathbf y}\) \(\newcommand{\zvec}{\mathbf z}\) \(\newcommand{\rvec}{\mathbf r}\) \(\newcommand{\mvec}{\mathbf m}\) \(\newcommand{\zerovec}{\mathbf 0}\) \(\newcommand{\onevec}{\mathbf 1}\) \(\newcommand{\real}{\mathbb R}\) \(\newcommand{\twovec}[2]{\left[\begin{array}{r}#1 \\ #2 \end{array}\right]}\) \(\newcommand{\ctwovec}[2]{\left[\begin{array}{c}#1 \\ #2 \end{array}\right]}\) \(\newcommand{\threevec}[3]{\left[\begin{array}{r}#1 \\ #2 \\ #3 \end{array}\right]}\) \(\newcommand{\cthreevec}[3]{\left[\begin{array}{c}#1 \\ #2 \\ #3 \end{array}\right]}\) \(\newcommand{\fourvec}[4]{\left[\begin{array}{r}#1 \\ #2 \\ #3 \\ #4 \end{array}\right]}\) \(\newcommand{\cfourvec}[4]{\left[\begin{array}{c}#1 \\ #2 \\ #3 \\ #4 \end{array}\right]}\) \(\newcommand{\fivevec}[5]{\left[\begin{array}{r}#1 \\ #2 \\ #3 \\ #4 \\ #5 \\ \end{array}\right]}\) \(\newcommand{\cfivevec}[5]{\left[\begin{array}{c}#1 \\ #2 \\ #3 \\ #4 \\ #5 \\ \end{array}\right]}\) \(\newcommand{\mattwo}[4]{\left[\begin{array}{rr}#1 \amp #2 \\ #3 \amp #4 \\ \end{array}\right]}\) \(\newcommand{\laspan}[1]{\text{Span}\{#1\}}\) \(\newcommand{\bcal}{\cal B}\) \(\newcommand{\ccal}{\cal C}\) \(\newcommand{\scal}{\cal S}\) \(\newcommand{\wcal}{\cal W}\) \(\newcommand{\ecal}{\cal E}\) \(\newcommand{\coords}[2]{\left\{#1\right\}_{#2}}\) \(\newcommand{\gray}[1]{\color{gray}{#1}}\) \(\newcommand{\lgray}[1]{\color{lightgray}{#1}}\) \(\newcommand{\rank}{\operatorname{rank}}\) \(\newcommand{\row}{\text{Row}}\) \(\newcommand{\col}{\text{Col}}\) \(\renewcommand{\row}{\text{Row}}\) \(\newcommand{\nul}{\text{Nul}}\) \(\newcommand{\var}{\text{Var}}\) \(\newcommand{\corr}{\text{corr}}\) \(\newcommand{\len}[1]{\left|#1\right|}\) \(\newcommand{\bbar}{\overline{\bvec}}\) \(\newcommand{\bhat}{\widehat{\bvec}}\) \(\newcommand{\bperp}{\bvec^\perp}\) \(\newcommand{\xhat}{\widehat{\xvec}}\) \(\newcommand{\vhat}{\widehat{\vvec}}\) \(\newcommand{\uhat}{\widehat{\uvec}}\) \(\newcommand{\what}{\widehat{\wvec}}\) \(\newcommand{\Sighat}{\widehat{\Sigma}}\) \(\newcommand{\lt}{<}\) \(\newcommand{\gt}{>}\) \(\newcommand{\amp}{&}\) \(\definecolor{fillinmathshade}{gray}{0.9}\)The interpretation of main effects and interactions can get tricky. Consider the concept of a main effect. This is the idea that a particular IV has a consistent effect. For example, drinking five cups of coffee makes you more awake compared to not drinking five cups of coffee. The main effect of drinking five cups of coffee versus not drinking coffee will generally be true across the levels of other IVs in our life. For example, let’s say you conducted an experiment testing whether the effect of drinking five cups of coffee versus not, changes depending on whether you are in your house or in a car. Perhaps the situation matters? No, probably not so much. You will probably still be more awake in your house, or your car, after having five cups of coffee, compared to if you hadn’t.
The coffee example is a reasonably good example of a consistent main effect. Another silly kind of example might be the main effect of shoes on your height. For example, if your IV was wearing shoes or not, and your DV was height, then we could expect to find a main effect of wearing shoes on your measurement of height. When you wear shoes, you will become taller compared to when you don’t wear shoes. Wearing shoes adds to your total height. In fact, it’s hard to imagine how the effect of wearing shoes on your total height would ever interact with other kinds of variables. You will be always be that extra bit taller wearing shoes. Indeed, if there was another manipulation that could cause an interaction that would truly be strange. For example, imagine if the effect of being inside a bodega or outside a bodega interacted with the effect of wearing shoes on your height. That could mean that shoes make you taller when you are outside a bodega, but when you step inside, your shoes make you shorter…but, obviously this is just totally ridiculous. That’s correct, it is often ridiculous to expect that one IV will have an influence on the effect of another, especially when there is no good reason.
The summary here is that it is convenient to think of main effects as a consistent influence of one manipulation. However, when an interaction is observed, this messes up the consistency of the main effect. That is the very definition of an interaction. It means that some main effect is not behaving consistently across different situations. Indeed, whenever we find an interaction, sometimes we can question whether or not there really is a general consistent effect of some manipulation, or instead whether that effect only happens in specific situations.
For this reason, you will often see that researchers report their findings this way:
“We found a main effect of X, BUT, this main effect was qualified by an interaction between X and Y”.
Notice the big BUT. Why is it there? The sentence points out that before they talk about the main effect, they need to first talk about the interaction, which is making the main effect behave inconsistently. In other words, the interpretation of the main effect depends on the interaction, the two things have to be thought of together to make sense of them.
Here are some examples to help you make sense of these issues:
Consistent
A consistent main effect and an interaction means that the results of the interaction follows the results of the main effect. What's going on here? As you can see, the top line (Level 2 of IV2) goes down. The bottom line (Level 1 of IV2) goes up. IV1 is represented by the endpoints of the lines, with Level A of IV1 on the left and Level B of IV1 on the right.

There is a main effect of IV2: the level 1 means (red line on the bottom) are both lower than the level 2 means (aqua line on the top). There is also an interaction. The size of the difference between the red and aqua points in the A condition (left) is bigger than the size of the difference in the B condition. This means that you couldn't just look at the main effect of IV2, you have to also take into account how IV1 affects IV2.
How would we interpret this?
We could say there WAS a main effect of IV2, BUT it was qualified by an IV1 x IV2 interaction.
What’s the qualification?
The size of the IV2 effect changed as a function of the levels of IV1. It was big for level A, and small for level B of IV1.
What does the qualification mean for the main effect?
Well, first it means the main effect can be changed by the other IV. That’s important to know. Does it also mean that the main effect is not a real main effect because there was an interaction? Not really, there is a generally consistent effect of IV2. The green points are above the red points in all cases. Whatever IV2 is doing, it seems to work in at least a couple situations, even if the other IV also causes some change to the influence.
Let’s try an example to show that a consistent interaction, when the interaction is similar to one or both sets of main effects.
| IV Levels | IV1 (Task Presentation): Paper | IV1 Task Presentation): Computer |
|---|---|---|
| IV2 (Task Difficulty): Easy | 80 | 90 |
| IV2 (Task Difficulty): Hard | 40 | 70 |
| Marginal Means of IV1: | 60 | 80 |
How would we interpret this?
As shown in Table \(\PageIndex{1}\), there is a main effect for Task Presentation; overall, performance was better using computer than using paper. (There is also a main effect for Task Difficulty; overall, performance was better on the easier task, but the means are shown to make these examples easier to follow.).
What’s the qualification?
The interaction shows that both Task Presentation and Task Difficulty affect the DV.
What does the qualification mean for the main effect?
The pattern of the main effect of Task Presentation is consistent for both easy tasks and for hard tasks.
Consistency amongst interactions and mains effect is the simplest relationship between a main effect and an interaction. Let's look at one that makes interpreting the main effects more difficult.
Inconsistent
An inconsistent main effect and an interaction is shown in Figure \(\PageIndex{2}\). What's going on here? As you can see, the top line (Level 2 of IV2) goes down sharply. The bottom line (Level 1 of IV2) stays flat. IV1 is represented by the endpoints of the lines, with Level A of IV1 on the left and Level B of IV1 on the right.

You should see an interaction here straight away. The difference between the aqua and red points in condition A (left two dots) is huge, and there is no difference between them in condition B. Is there an interaction? Yes!
Are there any main effects here? With data like this, sometimes an ANOVA will suggest that you do have significant main effects. For example, what is the mean difference between level 1 and 2 of IV2? That is the average of the green points ( (10+5)/2 = 15/2= 7.5 ) compared to the average of the red points (5). There will be a difference of 2.5 for the main effect (7.5 vs. 5).
Starting to see the issue here? From the perspective of the main effect (which collapses over everything and ignores the interaction), there is an overall effect of 2.5. In other words, level 2 adds 2.5 in general compared to level 1. However, we can see from the graph that IV2 does not do anything in general. It does not add 2.5s everywhere. It adds 5 in condition A, and nothing in condition B. It only does one thing in one condition.
What is happening here is that a “main effect” is produced by the process of averaging over a clear interaction.
How would we interpret this?
We might have to say there was a main effect of IV2, BUT we would definetely say it was qualified by an IV1 x IV2 interaction.
What’s the qualification?
The size of the IV2 effect completely changes as a function of the levels of IV1. It was big for level A, and nonexistent for level B of IV1.
What does the qualification mean for the main effect?
In this case, we might doubt whether there is a main effect of IV2 at all. It could turn out that IV2 does not have a general influence over the DV all of the time, it may only do something in very specific circumstances, in combination with the presence of other factors.
Let's try that with some examples.
| IV Levels | IV1 (Task Presentation): Paper | IV1 Task Presentation): Computer |
| IV2 (Task Difficulty): Easy | 90 | 90 |
| IV2 (Task Difficulty): Hard | 40 | 70 |
|---|---|---|
| Marginal Means of IV1: | 65 | 80 |
How would we interpret this?
Sometimes the interaction shows effects that the main effects miss or are opposite of the main effects. In Table \(\PageIndex{2}\), there is a main effect for Task Presentation, overall performance was better using computer presentation than using paper presentation. (There is also a main effect for Task Difficulty; overall, performance was better on the easier task, but the means are shown to make these examples easier to follow.).
What’s the qualification?
In Table \(\PageIndex{2}\), what did the main effect of Task Presentation miss?
Solution
Performance is better on the computer but only for hard tasks (not for easy tasks). Performance the same for Paper and Computer for Easy tasks.
What does the qualification mean for the main effect?
This qualification means that the interaction is inconsistent with the main effects; performance is affected by both Task Difficulty and Task Presentation.
Another form of inconsistency is when the main effects do not show a difference, but the IV levels do affect the DV.
| IV Levels | IV1 Task Presentation): Computer | IV1 (Task Presentation): Paper |
| IV2 (Task Difficulty): Easy | 90 | 70 |
| IV2 (Task Difficulty): Hard | 40 | 60 |
|---|---|---|
| Marginal Means of IV1: | 65 | 65 |
How would we interpret this?
There is no main effect for Task Presentation in Figure 3, overall performance was equivalent using computer presentation and using paper presentation.
What’s the qualification?
This pattern is inconsistent with the interaction.
What does the qualification mean for the main effect?
In this example, Task Presentation does matter for easy tasks.
This is why interactions are so important to look at. Sometimes the main effects tell us most of what we need to know, but sometimes main effects hide what is really happening.
Try it Yourself
Let’s look at the Mindset Quiz pretest scores when faculty in English and Psychology tried to improve their students’ mindset. This is different from the Difference scores that we looked at earlier. This time, we are only looking at the posttests, the scores on the Mindset Quiz at the end of the semester. Review Table \(\PageIndex{4}\) and Figure \(\PageIndex{3}\), and decide if you think that the main effects are consistent or inconsistent with the interaction.
Table \(\PageIndex{4}\) shows the marginal means and the cell means for our two IVs (Intervention: Yes or No; Department: English or Psychology).
| IV Levels | IV1: Yes Intervention | IV1: No Intervention | Marginal Means for IV2: |
| IV2: English Department | 41.15 | 41.43 | 41.29 |
| IV2: Psychology Department | 46.46 | 41.60 | 44.03 |
|---|---|---|---|
| Margin Means for IV1: | 43.8 | 41.51 | (You could put the total mean here...) |
How would we interpret this?
Let’s first look at the main effects in Table \(\PageIndex{4}\). Without doing a null hypothesis significance test, we might guess that there was a significant different between those who were going to receive the intervention and those who were not going to receive the intervention based on the means; remember, these are pretest scores so no one had received the intervention yet! So right off, that’s an odd finding. Why would students already having a higher score on the Mindset Quiz? Do you think that the professor was subtly supporting growth mindset in only the classes that were going to have the intervention?
Now for the department. Without doing an null hypothesis significance testing, we might guess that there was a significant difference with the Psychology students having higher scores on the Mindset Quiz (slightly more growth mindset) than the English students. Again, this is surprising for a pretest. Why would Psychology students have a growth mindset more than English students?
On the other hand, we didn’t conduct any null hypothesis significance testing, so maybe these means are actually close enough to say that they are similar. At this point, we just don’t know.
But let’s move on to the interaction. Looking at the four cells in the middle of the table, what do you see?
Does one cell in the middle of Table \(\PageIndex{4}\) seem substantially higher? Or substantially lower?
Solution
It looks like the combination of IV levels strengthened the effect of the IVs alone. When discussing the main effects we said that it looks like the students who were going to get the intervention (IV1 = Yes) already scored higher on the Mindset Quiz, and the Psychology students scored higher on the pretest than English students. When looking at these in combination, it looks like the only the Psychology classes that were going to receive the intervention scored higher, not everyone who was going to receive the intervention. This high average score on the Mindset Quiz pretest for Psychology students who were going to receive the intervention seems to have increased the marginal mean for both the Intervention IV and the Department IV.
When you look at Figure \(\PageIndex{3}\), do you see these means? The top line represents those who experienced an intervention (IV1, Level: Yes), and rises sharply. The dashed bottom line represents those who did not experience an intervention (IV1, Level: No). This dashed line most stays flat. IV2 is represented by the endpoints of the lines, with the English Department on the left and the Psychology Department on the right. This means that the one group that looks really different are those in Psychology who experienced the intervention.
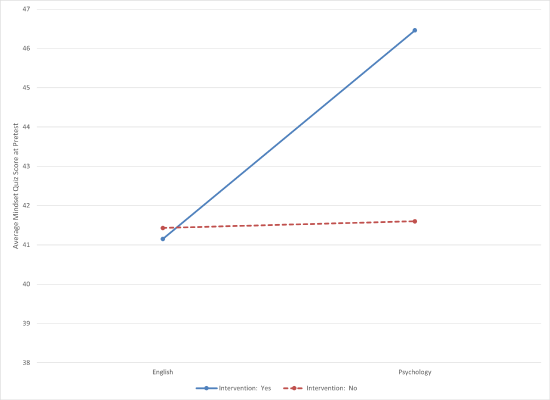
Figure \(\PageIndex{3}\) makes it very clear that there is an interaction (the lines are not parallel). It also makes clear that the scores for English students weren’t affected by the other IV (dots on the left), and that those who were not going to experience an intervention (dashed line) did not differ between the two departments. But, woah nelly, look at the blue dot representing students who were going to receive an intervention in a Psychology class! Based on the scaling of this chart, it looks like their mean was wildly higher than the other combinations.
What’s the qualification?
The size of the effect of the Department (IV2) completely changes as a function of the levels of Intervention (IV1).
What does the qualification mean for the main effect?
It might mean that the main effect of Department doesn’t really matter because the change in Mindset Quiz pretest scores only changes when in a Psychology class that will receive an intervention.
Consistent or Inconsistent?
Are the main effects are consistent or inconsistent with the interaction?
Solution
Both main effects are consistent with the interaction.
Do main effects mean anything?
When should you pay attention to mean differences in main effects?
Solution
When there are no interactions.
When there are no interactions, the main effects for each IV are like separate ANOVAs. An ANOVA with one IV. This is what makes interpreting main effects risky when there's an interaction. The interaction may be all that is happening, but based on the means of only one of the IVs, it looks like that IV is influencing the DV on its own.