
3.1: What is Central Tendency?
- Page ID
- 14464

What is “central tendency,” and why do we want to know the central tendency of a group of scores? Let us first try to answer these questions intuitively. Then we will proceed to a more formal discussion.
Imagine this situation: You are in a class with just four other students, and the five of you took a 5-point pop quiz. Today your instructor is walking around the room, handing back the quizzes. She stops at your desk and hands you your paper. Written in bold black ink on the front is “3/5.” How do you react? Are you happy with your score of 3 or disappointed? How do you decide? You might calculate your percentage correct, realize it is 60%, and be appalled. But it is more likely that when deciding how to react to your performance, you will want additional information. What additional information would you like?
If you are like most students, you will immediately ask your neighbors, “Whad'ja get?” and then ask the instructor, “How did the class do?” In other words, the additional information you want is how your quiz score compares to other students' scores. You therefore understand the importance of comparing your score to the class distribution of scores. Should your score of 3 turn out to be among the higher scores, then you'll be pleased after all. On the other hand, if 3 is among the lower scores in the class, you won't be quite so happy.
This idea of comparing individual scores to a distribution of scores is fundamental to statistics. So let's explore it further, using the same example (the pop quiz you took with your four classmates). Three possible outcomes are shown in Table \(\PageIndex{1}\). They are labeled “Dataset A,” “Dataset B,” and “Dataset C.” Which of the three datasets would make you happiest? In other words, in comparing your score with your fellow students' scores, in which dataset would your score of 3 be the most impressive?
| Student | Dataset A | Dataset B | Dataset C |
|---|---|---|---|
| You | 3 | 3 | 3 |
| John's | 3 | 4 | 2 |
| Maria's | 3 | 4 | 2 |
| Shareecia's | 3 | 4 | 2 |
| Luther's | 3 | 5 | 1 |
In Dataset A, everyone's score is 3. This puts your score at the exact center of the distribution. You can draw satisfaction from the fact that you did as well as everyone else. But of course it cuts both ways: everyone else did just as well as you.
Now consider the possibility that the scores are described as in Dataset B. This is a depressing outcome even though your score is no different than the one in Dataset A. The problem is that the other four students had higher grades, putting yours below the center of the distribution.
Finally, let's look at Dataset C. This is more like it! All of your classmates score lower than you so your score is above the center of the distribution.
Now let's change the example in order to develop more insight into the center of a distribution. Figure \(\PageIndex{1}\) shows the results of an experiment on memory for chess positions. Subjects were shown a chess position and then asked to reconstruct it on an empty chess board. The number of pieces correctly placed was recorded. This was repeated for two more chess positions. The scores represent the total number of chess pieces correctly placed for the three chess positions. The maximum possible score was 89.
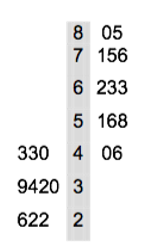
Two groups are compared. On the left are people who don't play chess. On the right are people who play a great deal (tournament players). It is clear that the location of the center of the distribution for the non-players is much lower than the center of the distribution for the tournament players.
We're sure you get the idea now about the center of a distribution. Here is another way for you to try to grasp the idea of a central tendency.
Balance Scale
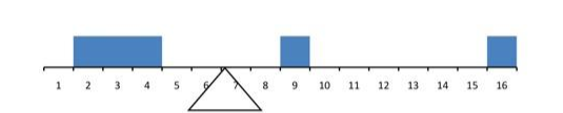
One definition of central tendency is the point at which the distribution is in balance. Figure \(\PageIndex{2}\) shows the distribution of the five numbers 2, 3, 4, 9, 16 placed upon a balance scale. If each number weighs one pound, and is placed at its position along the number line, then it would be possible to balance them by placing a fulcrum at 6.8.
For another example, consider the distribution shown in Figure \(\PageIndex{3}\). It is balanced by placing the fulcrum in the geometric middle.
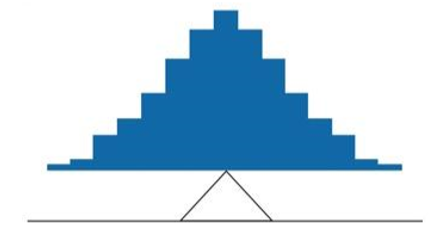
Figure \(\PageIndex{4}\) illustrates that the same distribution can't be balanced by placing the fulcrum to the left of center.
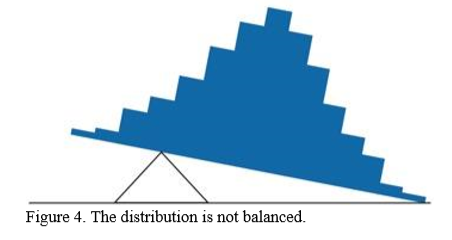
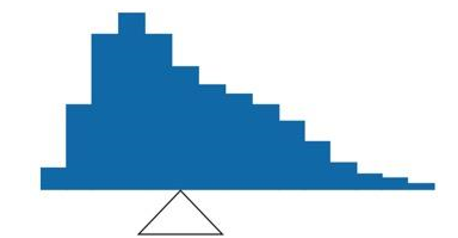
Figure \(\PageIndex{5}\) shows an asymmetric distribution. To balance it, we cannot put the fulcrum halfway between the lowest and highest values (as we did in Figure \(\PageIndex{3}\)). Placing the fulcrum at the “half way” point would cause it to tip towards the left.
There are other ways to try to define the central tendency, but for our purposes, this will suffice.
Contributors
Foster et al. (University of Missouri-St. Louis, Rice University, & University of Houston, Downtown Campus)