
1.2 Data, Sampling, and Variation in Data and Sampling
- Page ID
- 36444
\( \newcommand{\vecs}[1]{\overset { \scriptstyle \rightharpoonup} {\mathbf{#1}} } \)
\( \newcommand{\vecd}[1]{\overset{-\!-\!\rightharpoonup}{\vphantom{a}\smash {#1}}} \)
\( \newcommand{\dsum}{\displaystyle\sum\limits} \)
\( \newcommand{\dint}{\displaystyle\int\limits} \)
\( \newcommand{\dlim}{\displaystyle\lim\limits} \)
\( \newcommand{\id}{\mathrm{id}}\) \( \newcommand{\Span}{\mathrm{span}}\)
( \newcommand{\kernel}{\mathrm{null}\,}\) \( \newcommand{\range}{\mathrm{range}\,}\)
\( \newcommand{\RealPart}{\mathrm{Re}}\) \( \newcommand{\ImaginaryPart}{\mathrm{Im}}\)
\( \newcommand{\Argument}{\mathrm{Arg}}\) \( \newcommand{\norm}[1]{\| #1 \|}\)
\( \newcommand{\inner}[2]{\langle #1, #2 \rangle}\)
\( \newcommand{\Span}{\mathrm{span}}\)
\( \newcommand{\id}{\mathrm{id}}\)
\( \newcommand{\Span}{\mathrm{span}}\)
\( \newcommand{\kernel}{\mathrm{null}\,}\)
\( \newcommand{\range}{\mathrm{range}\,}\)
\( \newcommand{\RealPart}{\mathrm{Re}}\)
\( \newcommand{\ImaginaryPart}{\mathrm{Im}}\)
\( \newcommand{\Argument}{\mathrm{Arg}}\)
\( \newcommand{\norm}[1]{\| #1 \|}\)
\( \newcommand{\inner}[2]{\langle #1, #2 \rangle}\)
\( \newcommand{\Span}{\mathrm{span}}\) \( \newcommand{\AA}{\unicode[.8,0]{x212B}}\)
\( \newcommand{\vectorA}[1]{\vec{#1}} % arrow\)
\( \newcommand{\vectorAt}[1]{\vec{\text{#1}}} % arrow\)
\( \newcommand{\vectorB}[1]{\overset { \scriptstyle \rightharpoonup} {\mathbf{#1}} } \)
\( \newcommand{\vectorC}[1]{\textbf{#1}} \)
\( \newcommand{\vectorD}[1]{\overrightarrow{#1}} \)
\( \newcommand{\vectorDt}[1]{\overrightarrow{\text{#1}}} \)
\( \newcommand{\vectE}[1]{\overset{-\!-\!\rightharpoonup}{\vphantom{a}\smash{\mathbf {#1}}}} \)
\( \newcommand{\vecs}[1]{\overset { \scriptstyle \rightharpoonup} {\mathbf{#1}} } \)
\(\newcommand{\longvect}{\overrightarrow}\)
\( \newcommand{\vecd}[1]{\overset{-\!-\!\rightharpoonup}{\vphantom{a}\smash {#1}}} \)
\(\newcommand{\avec}{\mathbf a}\) \(\newcommand{\bvec}{\mathbf b}\) \(\newcommand{\cvec}{\mathbf c}\) \(\newcommand{\dvec}{\mathbf d}\) \(\newcommand{\dtil}{\widetilde{\mathbf d}}\) \(\newcommand{\evec}{\mathbf e}\) \(\newcommand{\fvec}{\mathbf f}\) \(\newcommand{\nvec}{\mathbf n}\) \(\newcommand{\pvec}{\mathbf p}\) \(\newcommand{\qvec}{\mathbf q}\) \(\newcommand{\svec}{\mathbf s}\) \(\newcommand{\tvec}{\mathbf t}\) \(\newcommand{\uvec}{\mathbf u}\) \(\newcommand{\vvec}{\mathbf v}\) \(\newcommand{\wvec}{\mathbf w}\) \(\newcommand{\xvec}{\mathbf x}\) \(\newcommand{\yvec}{\mathbf y}\) \(\newcommand{\zvec}{\mathbf z}\) \(\newcommand{\rvec}{\mathbf r}\) \(\newcommand{\mvec}{\mathbf m}\) \(\newcommand{\zerovec}{\mathbf 0}\) \(\newcommand{\onevec}{\mathbf 1}\) \(\newcommand{\real}{\mathbb R}\) \(\newcommand{\twovec}[2]{\left[\begin{array}{r}#1 \\ #2 \end{array}\right]}\) \(\newcommand{\ctwovec}[2]{\left[\begin{array}{c}#1 \\ #2 \end{array}\right]}\) \(\newcommand{\threevec}[3]{\left[\begin{array}{r}#1 \\ #2 \\ #3 \end{array}\right]}\) \(\newcommand{\cthreevec}[3]{\left[\begin{array}{c}#1 \\ #2 \\ #3 \end{array}\right]}\) \(\newcommand{\fourvec}[4]{\left[\begin{array}{r}#1 \\ #2 \\ #3 \\ #4 \end{array}\right]}\) \(\newcommand{\cfourvec}[4]{\left[\begin{array}{c}#1 \\ #2 \\ #3 \\ #4 \end{array}\right]}\) \(\newcommand{\fivevec}[5]{\left[\begin{array}{r}#1 \\ #2 \\ #3 \\ #4 \\ #5 \\ \end{array}\right]}\) \(\newcommand{\cfivevec}[5]{\left[\begin{array}{c}#1 \\ #2 \\ #3 \\ #4 \\ #5 \\ \end{array}\right]}\) \(\newcommand{\mattwo}[4]{\left[\begin{array}{rr}#1 \amp #2 \\ #3 \amp #4 \\ \end{array}\right]}\) \(\newcommand{\laspan}[1]{\text{Span}\{#1\}}\) \(\newcommand{\bcal}{\cal B}\) \(\newcommand{\ccal}{\cal C}\) \(\newcommand{\scal}{\cal S}\) \(\newcommand{\wcal}{\cal W}\) \(\newcommand{\ecal}{\cal E}\) \(\newcommand{\coords}[2]{\left\{#1\right\}_{#2}}\) \(\newcommand{\gray}[1]{\color{gray}{#1}}\) \(\newcommand{\lgray}[1]{\color{lightgray}{#1}}\) \(\newcommand{\rank}{\operatorname{rank}}\) \(\newcommand{\row}{\text{Row}}\) \(\newcommand{\col}{\text{Col}}\) \(\renewcommand{\row}{\text{Row}}\) \(\newcommand{\nul}{\text{Nul}}\) \(\newcommand{\var}{\text{Var}}\) \(\newcommand{\corr}{\text{corr}}\) \(\newcommand{\len}[1]{\left|#1\right|}\) \(\newcommand{\bbar}{\overline{\bvec}}\) \(\newcommand{\bhat}{\widehat{\bvec}}\) \(\newcommand{\bperp}{\bvec^\perp}\) \(\newcommand{\xhat}{\widehat{\xvec}}\) \(\newcommand{\vhat}{\widehat{\vvec}}\) \(\newcommand{\uhat}{\widehat{\uvec}}\) \(\newcommand{\what}{\widehat{\wvec}}\) \(\newcommand{\Sighat}{\widehat{\Sigma}}\) \(\newcommand{\lt}{<}\) \(\newcommand{\gt}{>}\) \(\newcommand{\amp}{&}\) \(\definecolor{fillinmathshade}{gray}{0.9}\)Learning Objectives
In this section, you will:
- Recognize and differentiate between types of data.
- Recognize and apply various types of sampling methods.
- Evaluate statistical studies before accepting results.
Types of Data
• Qualitative data (Categorical data): data that consists of names or labels that does not represent counts or measurements.
• Quantitative data: data that is numerical, representing counts or measurements.
Types of Quantitative data:
• Discrete: All data that are the result of counting.
• Continuous: All data that are the result of measuring.
Example 1:
Determine the correct data type (quantitative or qualitative). Indicate whether quantitative data are continuous or discrete. Hint: Data that are discrete often start with the words "the number of."
a. the number of pairs of shoes you own
b. the type of car you drive
c. the distance it is from your home to the nearest grocery store
d. the number of classes you take per school year.
e. the type of calculator you use
f. weights of sumo wrestlers
g. number of correct answers on a quiz
h. IQ scores (This may cause some discussion.)
Graphs that are used to display qualitative data
Pie chart
In a pie chart, categories of data are represented by wedges in a circle and are proportional in size to the percent of individuals in each category.


Example shows two pie charts. First: De Anza College shows 59.1% of individuals work part time and 40.9% work full time.
Second: Foothill College 71.4% work Part time and 28.6% work full time.
Bar graph
In a bar graph, the length of the bar for each category is proportional to the number or percent of individuals in each category. Bars may be vertical or horizontal.

Example is a bar graph depicting student full time and part time status. De Anza shows there are more part time students than
full time, and for Foothill there are more Part time than full time.
Pareto Chart
A Pareto chart consists of bars that are sorted into order by category size (largest to smallest).
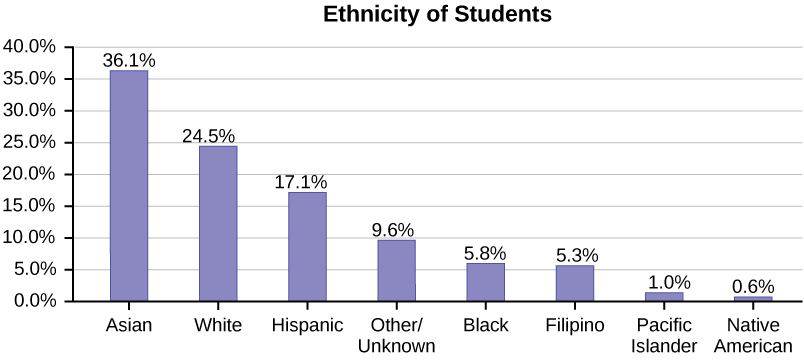
This bar graph is graphed from largest to smallest ethnicity of students with Asian students with the largest number at 36.1%,
white 24.5%, Hispanic 17.1%, Other/Unknown 9.6%, Black 5.8%, Filipino 5.3%, Pacific Islander 1.0%, Native American 0.6%.
Sampling Methods
Gathering information about an entire population often costs too much or is virtually impossible. Instead, we use a sample of the population.
• A sample should have the same characteristics as the population it is representing.
• Random sampling is a method of achieving this goal.
There are several different methods of random sampling.
• Simple random sample. Each sample of the same size has an equal chance of being selected.
• Stratified sample. Divide the population into groups called strata and then take a proportionate number from each stratum.
• Cluster sample. Divide the population into clusters (groups) and then randomly select some of the clusters. All the members from these clusters are in the cluster sample.
• To choose a systematic sample, randomly select a starting point and take every nth piece of data from a listing of the population.
Convenience sampling is a non-random method of selecting a sample. This method selects individuals that are easily available and may result in bias data.
Sampling with replacement
• Once a member is picked, that member goes back into the population and thus may be chosen more than once
Sampling without replacement
• A member of the population may be chosen only once
Example 2:
Determine the type of sampling used (simple random, stratified, systematic, cluster, or convenience).
A. A soccer coach selects six players from a group of boys aged eight to ten, seven players from a group of boys aged 11 to 12, and three players from a group of boys aged 13 to 14 to form a recreational soccer team.
B. A pollster interviews all human resource personnel in five different high tech companies.
C. A high school educational researcher interviews 50 high school female teachers and 50 high school male teachers.
D. A medical researcher interviews every third cancer patient from a list of cancer patients at a local hospital.
E. A high school counselor uses a computer to generate 50 random numbers and then picks students whose names correspond to the numbers.
F. A student interviews classmates in his algebra class to determine how many pairs of jeans a student owns, on the average.
In statistics, a sampling bias is created when a sample is collected from a population and some members of the population are not as likely to be chosen as others. When a sampling bias happens, there can be incorrect conclusions drawn about the population that is being studied
Critical Evaluation
We need to evaluate the statistical studies we read about critically and analyze them before accepting the results of the studies. Common problems to be aware of include:
• Self-selected or Voluntary response samples: Responses only by people who choose to respond.
• Small samples: Samples that are too small may be unreliable
• Undue influence: Collecting data or asking questions in a way that influences the response. Loaded question.
• Non-response or refusal of subject to participate.
• Causality: A relationship between two variables does not mean that one causes the other to occur. Correlation does not imply causation.•
• Self-funded or self-interest studies: A study performed by a person or organization in order to support their claim.
• Misleading use of data: improperly displayed graphs, incomplete data, or lack of context.
Example 3:
Determine whether or not the following samples are representative.
1. To find the average GPA of all students in a university, use all honor students at the university as the sample.
2.To find out the most popular cereal among young people under the age of ten, stand outside a large supermarket for three hours and speak to every twentieth child under age ten who enters the supermarket.
3.To find the average annual income of all adults in the United States, sample U.S. congressmen. Create a cluster sample by considering each state as a stratum (group). By using simple random sampling, select states to be part of the cluster. Then survey every U.S. congressman in the cluster.
4.To determine the proportion of people taking public transportation to work, survey 20 people in New York City. Conduct the survey by sitting in Central Park on a bench and interviewing every person who sits next to you.
5.To determine the average cost of a two-day stay in a hospital in Massachusetts, survey 100 hospitals across the state using simple random sampling.
For more information and examples see online textbook OpenStax Introductory Statistics pages 10-25.
“Introduction to Statistics” by OpenStax, used is licensed under a Creative Commons Attribution License 4.0 license.