
Ch 8.3 Confidence Interval for Population Proportion
- Page ID
- 15923
\( \newcommand{\vecs}[1]{\overset { \scriptstyle \rightharpoonup} {\mathbf{#1}} } \)
\( \newcommand{\vecd}[1]{\overset{-\!-\!\rightharpoonup}{\vphantom{a}\smash {#1}}} \)
\( \newcommand{\dsum}{\displaystyle\sum\limits} \)
\( \newcommand{\dint}{\displaystyle\int\limits} \)
\( \newcommand{\dlim}{\displaystyle\lim\limits} \)
\( \newcommand{\id}{\mathrm{id}}\) \( \newcommand{\Span}{\mathrm{span}}\)
( \newcommand{\kernel}{\mathrm{null}\,}\) \( \newcommand{\range}{\mathrm{range}\,}\)
\( \newcommand{\RealPart}{\mathrm{Re}}\) \( \newcommand{\ImaginaryPart}{\mathrm{Im}}\)
\( \newcommand{\Argument}{\mathrm{Arg}}\) \( \newcommand{\norm}[1]{\| #1 \|}\)
\( \newcommand{\inner}[2]{\langle #1, #2 \rangle}\)
\( \newcommand{\Span}{\mathrm{span}}\)
\( \newcommand{\id}{\mathrm{id}}\)
\( \newcommand{\Span}{\mathrm{span}}\)
\( \newcommand{\kernel}{\mathrm{null}\,}\)
\( \newcommand{\range}{\mathrm{range}\,}\)
\( \newcommand{\RealPart}{\mathrm{Re}}\)
\( \newcommand{\ImaginaryPart}{\mathrm{Im}}\)
\( \newcommand{\Argument}{\mathrm{Arg}}\)
\( \newcommand{\norm}[1]{\| #1 \|}\)
\( \newcommand{\inner}[2]{\langle #1, #2 \rangle}\)
\( \newcommand{\Span}{\mathrm{span}}\) \( \newcommand{\AA}{\unicode[.8,0]{x212B}}\)
\( \newcommand{\vectorA}[1]{\vec{#1}} % arrow\)
\( \newcommand{\vectorAt}[1]{\vec{\text{#1}}} % arrow\)
\( \newcommand{\vectorB}[1]{\overset { \scriptstyle \rightharpoonup} {\mathbf{#1}} } \)
\( \newcommand{\vectorC}[1]{\textbf{#1}} \)
\( \newcommand{\vectorD}[1]{\overrightarrow{#1}} \)
\( \newcommand{\vectorDt}[1]{\overrightarrow{\text{#1}}} \)
\( \newcommand{\vectE}[1]{\overset{-\!-\!\rightharpoonup}{\vphantom{a}\smash{\mathbf {#1}}}} \)
\( \newcommand{\vecs}[1]{\overset { \scriptstyle \rightharpoonup} {\mathbf{#1}} } \)
\(\newcommand{\longvect}{\overrightarrow}\)
\( \newcommand{\vecd}[1]{\overset{-\!-\!\rightharpoonup}{\vphantom{a}\smash {#1}}} \)
\(\newcommand{\avec}{\mathbf a}\) \(\newcommand{\bvec}{\mathbf b}\) \(\newcommand{\cvec}{\mathbf c}\) \(\newcommand{\dvec}{\mathbf d}\) \(\newcommand{\dtil}{\widetilde{\mathbf d}}\) \(\newcommand{\evec}{\mathbf e}\) \(\newcommand{\fvec}{\mathbf f}\) \(\newcommand{\nvec}{\mathbf n}\) \(\newcommand{\pvec}{\mathbf p}\) \(\newcommand{\qvec}{\mathbf q}\) \(\newcommand{\svec}{\mathbf s}\) \(\newcommand{\tvec}{\mathbf t}\) \(\newcommand{\uvec}{\mathbf u}\) \(\newcommand{\vvec}{\mathbf v}\) \(\newcommand{\wvec}{\mathbf w}\) \(\newcommand{\xvec}{\mathbf x}\) \(\newcommand{\yvec}{\mathbf y}\) \(\newcommand{\zvec}{\mathbf z}\) \(\newcommand{\rvec}{\mathbf r}\) \(\newcommand{\mvec}{\mathbf m}\) \(\newcommand{\zerovec}{\mathbf 0}\) \(\newcommand{\onevec}{\mathbf 1}\) \(\newcommand{\real}{\mathbb R}\) \(\newcommand{\twovec}[2]{\left[\begin{array}{r}#1 \\ #2 \end{array}\right]}\) \(\newcommand{\ctwovec}[2]{\left[\begin{array}{c}#1 \\ #2 \end{array}\right]}\) \(\newcommand{\threevec}[3]{\left[\begin{array}{r}#1 \\ #2 \\ #3 \end{array}\right]}\) \(\newcommand{\cthreevec}[3]{\left[\begin{array}{c}#1 \\ #2 \\ #3 \end{array}\right]}\) \(\newcommand{\fourvec}[4]{\left[\begin{array}{r}#1 \\ #2 \\ #3 \\ #4 \end{array}\right]}\) \(\newcommand{\cfourvec}[4]{\left[\begin{array}{c}#1 \\ #2 \\ #3 \\ #4 \end{array}\right]}\) \(\newcommand{\fivevec}[5]{\left[\begin{array}{r}#1 \\ #2 \\ #3 \\ #4 \\ #5 \\ \end{array}\right]}\) \(\newcommand{\cfivevec}[5]{\left[\begin{array}{c}#1 \\ #2 \\ #3 \\ #4 \\ #5 \\ \end{array}\right]}\) \(\newcommand{\mattwo}[4]{\left[\begin{array}{rr}#1 \amp #2 \\ #3 \amp #4 \\ \end{array}\right]}\) \(\newcommand{\laspan}[1]{\text{Span}\{#1\}}\) \(\newcommand{\bcal}{\cal B}\) \(\newcommand{\ccal}{\cal C}\) \(\newcommand{\scal}{\cal S}\) \(\newcommand{\wcal}{\cal W}\) \(\newcommand{\ecal}{\cal E}\) \(\newcommand{\coords}[2]{\left\{#1\right\}_{#2}}\) \(\newcommand{\gray}[1]{\color{gray}{#1}}\) \(\newcommand{\lgray}[1]{\color{lightgray}{#1}}\) \(\newcommand{\rank}{\operatorname{rank}}\) \(\newcommand{\row}{\text{Row}}\) \(\newcommand{\col}{\text{Col}}\) \(\renewcommand{\row}{\text{Row}}\) \(\newcommand{\nul}{\text{Nul}}\) \(\newcommand{\var}{\text{Var}}\) \(\newcommand{\corr}{\text{corr}}\) \(\newcommand{\len}[1]{\left|#1\right|}\) \(\newcommand{\bbar}{\overline{\bvec}}\) \(\newcommand{\bhat}{\widehat{\bvec}}\) \(\newcommand{\bperp}{\bvec^\perp}\) \(\newcommand{\xhat}{\widehat{\xvec}}\) \(\newcommand{\vhat}{\widehat{\vvec}}\) \(\newcommand{\uhat}{\widehat{\uvec}}\) \(\newcommand{\what}{\widehat{\wvec}}\) \(\newcommand{\Sighat}{\widehat{\Sigma}}\) \(\newcommand{\lt}{<}\) \(\newcommand{\gt}{>}\) \(\newcommand{\amp}{&}\) \(\definecolor{fillinmathshade}{gray}{0.9}\)Ch 8.3 Confidence Interval for population proportion:
Terms: Population proportion: p
Sample proportion: \( \hat{p} \) = (x/n)
Number of success: x; sample size: n
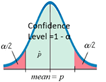
Confidence Level: C-level
Significant Level: α = 1 – C-level (probability of unlikely)
EBP: Error Bound for proportion, margin of error
A) To Estimate p:
\( \fbox {1) point estimate: \( \hat{p} = x/n \) } \)
\( \fbox{ 2) Interval estimate: \( \hat{p} - E \text{ to } \hat{p} + E \) } \)
\( E(EBP) = z_ {\alpha /2} \sqrt{\frac{\hat{p}\hat{q}}{n}} \)
Note: E is the approximated value of sampling error of sampling distribution of \( \hat{p} \), which has a normal distribution when x and n-x ≥ 5.
Use Statdisk online calculator to find the confidence interval.
- identify C-level, sample size n and success = x.
- https://www.statdisk.com/# , Analysis/ Confidence Intervals/Proportion one sample/
output: E (EBP) and lower < p < upper
\( z_ {\alpha /2} \) is the critical value with C-level in the middle.
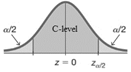 To find \( z_ {\alpha /2} \)
Use online Inverse Normal calculator, set area = \( \alpha /2 \), mean = 0, sd =1,
click above, recalculate.
Explanation:
X = number of success is a binomial distribution with mean = np and sd = \( \sqrt{npq} \).
When np and nq ≥ 5, distribution of X is normal with mean = np and sd = \( \sqrt{npq} \) .
So distribution of \( \hat{p} = \frac{x}{n} \) is normal with mean = p and SD = \( \sqrt{\frac{\hat{p}\hat{q}}{n}} \) .
At a given C-level, the maximum error of \( \hat{p} \) and p is E where \( E(EBP) = z_ {\alpha /2} \sqrt{\frac{\hat{p}\hat{q}}{n}} \)
Note: the requirement for this confidence interval is not n > 30 but np and nq ≥ 5.
Interpret a 95% Confidence Interval:
We are 95% confidence that the interval from ____ to ____ actual contain the true value of the population proportion of the category of interest.
The Confidence interval also shows that 95% of all confidence Intervals contain the true value of p.
Make conclusion from confidence interval:
1) Any value in the confidence Interval can be p.
2) If the whole interval > a, we can conclude p > a
3) If the whole interval < a, we can conclude p < a.
4) When two confidence interval overlap, we can conclude that the two p may be the same. We cannot conclude one of the p is higher.
Ex1. A research is conducted to determine how many household use Netflix to stream videos. A random sample of 500 households show that 442 households use Netflix.
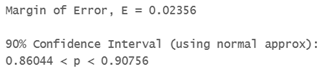
a) Use a 90% confidence level to compute a confidence interval estimate of true proportion of households using Netflix.
use Statdisk Analysis/Confidence Intervals/Proportion one sample : Clevel = 0.9, n = 500, x = 442,
b) Find the critical value.
Use Inverse Normal calculator, since clevel = 90%, \( \alpha = 0.1, \alpha /2 = 0.05 \), set area = 0.05, mean = 0, sd = 1,
click above, recalculate.
\( z_ {\alpha /2} \) = 1.645
c) Interpret the confidence interval in non-technical term.
We estimate with 90% confidence that the true proportion of all households that use Netflix is between 86.0% to 90.8%
d) Can we conclude with 90% confidence that more than 80% of households use Netflix?
Since the interval contains 86.0% to 90.8%, all values are more than 80%, so we can conclude that.
Ex2: A Gallup poll of 1487 adults showed that 43% of the respondents have Facebook pages.
a) Find the number in the sample who have Facebook pages. \( x = n(\hat{p}) \) = 1487 (0.43) = 639
c) Find the interval estimate of p at 95% confidence level and margin of error E.
Use statdisk with Clevel = 0.95, n = 1487, x = 639
Interval estimate is 0.405 < p < 0.455, E = 0.025
d) Write a non-technical interpretation of the above
We are 95% confidence that the true percent of adults who have Facebook pages are between 40.5% to 45.5%.
e) Can we claim that less than 60% of all adults have Facebook pages?
Since the whole interval is less than 0.6, yes, we can conclude less than 60% of all adults have Facebook pages.
B) Determine sample size for a desired E
Since \( E(EBP) = z_ {\alpha /2} \sqrt{\frac{\hat{p}\hat{q}}{n}} \)
\( n = \frac{(z_ {\alpha/2})^2\hat{p}\hat{q}}{E^2} \) when an estimate \( \hat{p} \) is known.
\( n = \frac{(z_ {\alpha/2})^2\cdot 0.25}{E^2} \) when no estimate \( \hat{p} \) is known.
Use statdisk / Analysis/Sample size Determination/ Estimate proportion to find sample size for a given error E.
Input C-Level, Desired E, Estimate of p = \( \hat{p} = \frac{x}{n} \), evaluate.
Ex3. What sample size should be used if we want the keep the margin of error within 2.1% when estimating a proportion at a 90% confidence interval. use \(\hat{p} = 0.43 \) as an old estimation of p.
C-level = 0.9, E = 0.021, estimate of p = 0.43, Evaluate
Sample size p = 1504.
b) If no previous study has been done , what sample size will be needed. (do not use p-hat = 0.43)
Use statdisk / Analysis/Sample size Determination/ Estimate proportion
C-level = 0.9, E = 0.021, estimate of p = blank, evaluate
sample size p = 1534