
Ch 7.1 Central Limit Theorem for Sample Means
( \newcommand{\kernel}{\mathrm{null}\,}\)
Ch 7.1 Central Limit Theorem for Sample Means
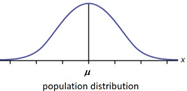
Sample distribution of sample mean:
When sample means ˉx of same size n taken from the same population, the Sample means have the following behavior:
1) If the population distribution of X is normal, the distribution of ˉx is always normal for all sample size n.
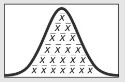
Sampling distribution of x-bar
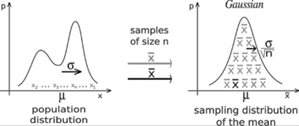
2) When population distribution of X is not normal, The sampling distribution x-bar tends to be a normal distribution. The distribution become closer to normal when sample size increase.
Activity to discover the Central Limit Theorem:
Central Limit Theorem for Sample Mean:
For all sample of the same size n with n > 30, the sampling distribution of ˉx can be approximated by a normal distribution with mean μ and standard deviation σˉx=σ√n
Note: -This applies to all distribution of x. If X is normally distributed, n > 30 is not needed. Any n will work.
![]() -The sample should be a Simple Random Sample.
-The sample should be a Simple Random Sample.
Central Limit Theorem: μˉx=μ,
\( \sigma _{\bar{x}} = \frac{\sigma}{\sqrt{n} \)}
Ex1 A standardized test with scores that are normally distributed with mean μ = 150 and standard deviation σ = 18. A class of 20 students take the test. The mean score ˉx of the 20 students are calculated.
a) Is the distribution of mean score ˉx of 20 students Normally distributed?
Ans: Yes because the original score is Normal.
a) What is the mean and standard deviation of ?
Use Central Limit Theorem: mean = 150, SD = 18√20 ≈ 4.0249
b) Find the probability that a student’s score is greater than 160.
 Use Online Normal Calculator, Mean = 150, SD = 4.0249
c) Find the probability that the mean score ˉx of 20 students is greater than 160.
Click above, enter 160. Recalculate. P( ˉx > 160) = 0.0065
Ex2: Coke cans are filled so that the actual amounts have a mean of 12 oz and a standard deviation of 0.11 oz. The distribution of amount of coke is unknown.
a) Is the distribution of mean amount of coke in 36 cans normally distributed?
Yes, because n > 30, according to CLT, ˉx will be normally distributed.
b) What is the mean and standard deviation of ˉx?
Ans: according to CLT: μˉx = 12, σˉx = 0.11/√36 ≈ 0.01833
c) Find the percent of individual coke with amount between 11.9 to 12.1 oz.
Use online Normal Calculator: Mean = 12, SD = 0.11
Click between, enter 11.9 and 12.1, Recalculate. P( 11.9 < x < 12.1 ) = 0.6367
63.67% of coke have amount between 11.9 oz to 12.1 oz.
d) Find the percent of mean amount of 36 coke with between 11.9 and 12.1 oz.
Use online Normal Calculator: Mean = 12, SD = 0.01833,
Click between, enter 11.9 and 12.1, Recalculate. P( 11.9 < ˉx < 12.1 ) = 1
100% of mean amount of 36 coke is between 11.9 and 12.1 oz.
Ex3. Annual incomes are known to have a distribution that is skewed to the right. Assume that 20
workers’ mean incomes ˉx are collected.
a) Will the distribution of mean income ˉx be normally distributed?
Ans: No, since X is not normal and n < 30, CLT does not apply, ˉx may not be normally distributed.