
Ch 5.1 Continuous Random Variable and Density Curve
- Page ID
- 15899
Ch 5.1 Continuous random variable
A) Density Curve
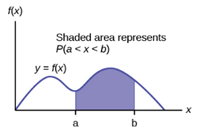
Probability of a Continuous Random Variable X is defined by its Probability Density Function(pdf) or density curve: \( f(x) \) so that
- Area under the density curve corresponds to probability or relative frequency (percent).
- Total area under the density curve is equal to 1
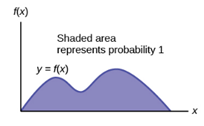
- the graph is always above x-axis.
|
Probability = Area = Percent |
Two important continuous Probability Distributions
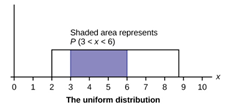
1) Uniform Distribution – The probability of X is equally likely to occur. Histogram of sample data usually bars of similar heights. There is lowest and highest value of X.
Ex1. X is modeled by Uniform Distribution for
lowest 2 and highest 8.8.
Probability that X is between 3 and 6 is the shaded area under the density curve.
b) Normal Distribution
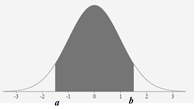
Probability that X is between a and b =
the area under the bell curve for x = a and x = b.
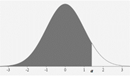
Shaded left area =
probability that x is less than a.
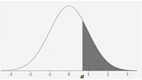
Shaded right area =
probability that x is greater than a.
Notation and property of probability of Continuous random variable X.
Probability that X = a: P(X = a) = 0
Probability that X is between a and b:
P( a < X < b) or P(a ≤ X ≤ b)
Probability that X is less than a: P( X < a) = P( X ≤ a)
Probability that X is greater than a: P(X > a) = P(x ≥ a)