
9.2E: Hypothesis Testing (Exercises)
- Page ID
- 20067

\( \newcommand{\vecs}[1]{\overset { \scriptstyle \rightharpoonup} {\mathbf{#1}} } \)
\( \newcommand{\vecd}[1]{\overset{-\!-\!\rightharpoonup}{\vphantom{a}\smash {#1}}} \)
\( \newcommand{\dsum}{\displaystyle\sum\limits} \)
\( \newcommand{\dint}{\displaystyle\int\limits} \)
\( \newcommand{\dlim}{\displaystyle\lim\limits} \)
\( \newcommand{\id}{\mathrm{id}}\) \( \newcommand{\Span}{\mathrm{span}}\)
( \newcommand{\kernel}{\mathrm{null}\,}\) \( \newcommand{\range}{\mathrm{range}\,}\)
\( \newcommand{\RealPart}{\mathrm{Re}}\) \( \newcommand{\ImaginaryPart}{\mathrm{Im}}\)
\( \newcommand{\Argument}{\mathrm{Arg}}\) \( \newcommand{\norm}[1]{\| #1 \|}\)
\( \newcommand{\inner}[2]{\langle #1, #2 \rangle}\)
\( \newcommand{\Span}{\mathrm{span}}\)
\( \newcommand{\id}{\mathrm{id}}\)
\( \newcommand{\Span}{\mathrm{span}}\)
\( \newcommand{\kernel}{\mathrm{null}\,}\)
\( \newcommand{\range}{\mathrm{range}\,}\)
\( \newcommand{\RealPart}{\mathrm{Re}}\)
\( \newcommand{\ImaginaryPart}{\mathrm{Im}}\)
\( \newcommand{\Argument}{\mathrm{Arg}}\)
\( \newcommand{\norm}[1]{\| #1 \|}\)
\( \newcommand{\inner}[2]{\langle #1, #2 \rangle}\)
\( \newcommand{\Span}{\mathrm{span}}\) \( \newcommand{\AA}{\unicode[.8,0]{x212B}}\)
\( \newcommand{\vectorA}[1]{\vec{#1}} % arrow\)
\( \newcommand{\vectorAt}[1]{\vec{\text{#1}}} % arrow\)
\( \newcommand{\vectorB}[1]{\overset { \scriptstyle \rightharpoonup} {\mathbf{#1}} } \)
\( \newcommand{\vectorC}[1]{\textbf{#1}} \)
\( \newcommand{\vectorD}[1]{\overrightarrow{#1}} \)
\( \newcommand{\vectorDt}[1]{\overrightarrow{\text{#1}}} \)
\( \newcommand{\vectE}[1]{\overset{-\!-\!\rightharpoonup}{\vphantom{a}\smash{\mathbf {#1}}}} \)
\( \newcommand{\vecs}[1]{\overset { \scriptstyle \rightharpoonup} {\mathbf{#1}} } \)
\(\newcommand{\longvect}{\overrightarrow}\)
\( \newcommand{\vecd}[1]{\overset{-\!-\!\rightharpoonup}{\vphantom{a}\smash {#1}}} \)
\(\newcommand{\avec}{\mathbf a}\) \(\newcommand{\bvec}{\mathbf b}\) \(\newcommand{\cvec}{\mathbf c}\) \(\newcommand{\dvec}{\mathbf d}\) \(\newcommand{\dtil}{\widetilde{\mathbf d}}\) \(\newcommand{\evec}{\mathbf e}\) \(\newcommand{\fvec}{\mathbf f}\) \(\newcommand{\nvec}{\mathbf n}\) \(\newcommand{\pvec}{\mathbf p}\) \(\newcommand{\qvec}{\mathbf q}\) \(\newcommand{\svec}{\mathbf s}\) \(\newcommand{\tvec}{\mathbf t}\) \(\newcommand{\uvec}{\mathbf u}\) \(\newcommand{\vvec}{\mathbf v}\) \(\newcommand{\wvec}{\mathbf w}\) \(\newcommand{\xvec}{\mathbf x}\) \(\newcommand{\yvec}{\mathbf y}\) \(\newcommand{\zvec}{\mathbf z}\) \(\newcommand{\rvec}{\mathbf r}\) \(\newcommand{\mvec}{\mathbf m}\) \(\newcommand{\zerovec}{\mathbf 0}\) \(\newcommand{\onevec}{\mathbf 1}\) \(\newcommand{\real}{\mathbb R}\) \(\newcommand{\twovec}[2]{\left[\begin{array}{r}#1 \\ #2 \end{array}\right]}\) \(\newcommand{\ctwovec}[2]{\left[\begin{array}{c}#1 \\ #2 \end{array}\right]}\) \(\newcommand{\threevec}[3]{\left[\begin{array}{r}#1 \\ #2 \\ #3 \end{array}\right]}\) \(\newcommand{\cthreevec}[3]{\left[\begin{array}{c}#1 \\ #2 \\ #3 \end{array}\right]}\) \(\newcommand{\fourvec}[4]{\left[\begin{array}{r}#1 \\ #2 \\ #3 \\ #4 \end{array}\right]}\) \(\newcommand{\cfourvec}[4]{\left[\begin{array}{c}#1 \\ #2 \\ #3 \\ #4 \end{array}\right]}\) \(\newcommand{\fivevec}[5]{\left[\begin{array}{r}#1 \\ #2 \\ #3 \\ #4 \\ #5 \\ \end{array}\right]}\) \(\newcommand{\cfivevec}[5]{\left[\begin{array}{c}#1 \\ #2 \\ #3 \\ #4 \\ #5 \\ \end{array}\right]}\) \(\newcommand{\mattwo}[4]{\left[\begin{array}{rr}#1 \amp #2 \\ #3 \amp #4 \\ \end{array}\right]}\) \(\newcommand{\laspan}[1]{\text{Span}\{#1\}}\) \(\newcommand{\bcal}{\cal B}\) \(\newcommand{\ccal}{\cal C}\) \(\newcommand{\scal}{\cal S}\) \(\newcommand{\wcal}{\cal W}\) \(\newcommand{\ecal}{\cal E}\) \(\newcommand{\coords}[2]{\left\{#1\right\}_{#2}}\) \(\newcommand{\gray}[1]{\color{gray}{#1}}\) \(\newcommand{\lgray}[1]{\color{lightgray}{#1}}\) \(\newcommand{\rank}{\operatorname{rank}}\) \(\newcommand{\row}{\text{Row}}\) \(\newcommand{\col}{\text{Col}}\) \(\renewcommand{\row}{\text{Row}}\) \(\newcommand{\nul}{\text{Nul}}\) \(\newcommand{\var}{\text{Var}}\) \(\newcommand{\corr}{\text{corr}}\) \(\newcommand{\len}[1]{\left|#1\right|}\) \(\newcommand{\bbar}{\overline{\bvec}}\) \(\newcommand{\bhat}{\widehat{\bvec}}\) \(\newcommand{\bperp}{\bvec^\perp}\) \(\newcommand{\xhat}{\widehat{\xvec}}\) \(\newcommand{\vhat}{\widehat{\vvec}}\) \(\newcommand{\uhat}{\widehat{\uvec}}\) \(\newcommand{\what}{\widehat{\wvec}}\) \(\newcommand{\Sighat}{\widehat{\Sigma}}\) \(\newcommand{\lt}{<}\) \(\newcommand{\gt}{>}\) \(\newcommand{\amp}{&}\) \(\definecolor{fillinmathshade}{gray}{0.9}\)Null and Alternative Hypotheses
Exercise \(\PageIndex{1}\)
You are testing that the mean speed of your cable Internet connection is more than three Megabits per second. What is the random variable? Describe in words.
Answer
The random variable is the mean Internet speed in Megabits per second.
Exercise \(\PageIndex{2}\)
You are testing that the mean speed of your cable Internet connection is more than three Megabits per second. State the null and alternative hypotheses.
Exercise \(\PageIndex{3}\)
The American family has an average of two children. What is the random variable? Describe in words.
Answer
The random variable is the mean number of children an American family has.
Exercise \(\PageIndex{4}\)
The mean entry level salary of an employee at a company is $58,000. You believe it is higher for IT professionals in the company. State the null and alternative hypotheses.
Exercise \(\PageIndex{5}\)
A sociologist claims the probability that a person picked at random in Times Square in New York City is visiting the area is 0.83. You want to test to see if the proportion is actually less. What is the random variable? Describe in words.
Answer
The random variable is the proportion of people picked at random in Times Square visiting the city.
Exercise \(\PageIndex{6}\)
A sociologist claims the probability that a person picked at random in Times Square in New York City is visiting the area is 0.83. You want to test to see if the claim is correct. State the null and alternative hypotheses.
Exercise \(\PageIndex{7}\)
In a population of fish, approximately 42% are female. A test is conducted to see if, in fact, the proportion is less. State the null and alternative hypotheses.
Answer
- \(H_{0}: p = 0.42\)
- \(H_{a}: p < 0.42\)
Exercise \(\PageIndex{8}\)
Suppose that a recent article stated that the mean time spent in jail by a first–time convicted burglar is 2.5 years. A study was then done to see if the mean time has increased in the new century. A random sample of 26 first-time convicted burglars in a recent year was picked. The mean length of time in jail from the survey was 3 years with a standard deviation of 1.8 years. Suppose that it is somehow known that the population standard deviation is 1.5. If you were conducting a hypothesis test to determine if the mean length of jail time has increased, what would the null and alternative hypotheses be? The distribution of the population is normal.
- \(H_{0}\):_______
- \(H_{a}\):_______
Exercise \(\PageIndex{9}\)
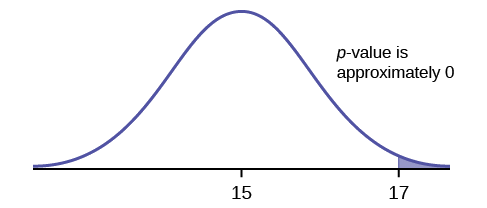
A random survey of 75 death row inmates revealed that the mean length of time on death row is 17.4 years with a standard deviation of 6.3 years. If you were conducting a hypothesis test to determine if the population mean time on death row could likely be 15 years, what would the null and alternative hypotheses be?
- \(H_{0}\):_________
- \(H_{a}\):_________
Answer
- \(H_{0}: \mu = 15\)
- \(H_{a}: \mu \neq 15\)
Exercise \(\PageIndex{10}\)
The National Institute 9.2.14 of Mental Health published an article stating that in any one-year period, approximately 9.5 percent of American adults suffer from depression or a depressive illness. Suppose that in a survey of 100 people in a certain town, seven of them suffered from depression or a depressive illness. If you were conducting a hypothesis test to determine if the true proportion of people in that town suffering from depression or a depressive illness is lower than the percent in the general adult American population, what would the null and alternative hypotheses be?
- \(H_{0}\):_______
- \(H_{a}\):_______
Outcomes and the Type I and Type II Errors
Exercise \(\PageIndex{11}\)
The mean price of mid-sized cars in a region is $32,000. A test is conducted to see if the claim is true. State the Type I and Type II errors in complete sentences.
- Answer
-
Type I: The mean price of mid-sized cars is $32,000, but we conclude that it is not $32,000.
Type II: The mean price of mid-sized cars is not $32,000, but we conclude that it is $32,000.
Exercise \(\PageIndex{12}\)
A sleeping bag is tested to withstand temperatures of –15 °F. You think the bag cannot stand temperatures that low. State the Type I and Type II errors in complete sentences.
Exercise \(\PageIndex{13}\)
For Exercise 9.12, what are \(\alpha\) and \(\beta\) in words?
- Answer
-
\(\alpha =\) the probability that you think the bag cannot withstand -15 degrees F, when in fact it can
\(\beta =\) the probability that you think the bag can withstand -15 degrees F, when in fact it cannot
Exercise \(\PageIndex{14}\)
In words, describe \(1 - \beta\).
Exercise \(\PageIndex{15}\)
A group of doctors is deciding whether or not to perform an operation. Suppose the null hypothesis, \(H_{0}\), is: the surgical procedure will go well. State the Type I and Type II errors in complete sentences.
- Answer
-
Type I: The procedure will go well, but the doctors think it will not.
Type II: The procedure will not go well, but the doctors think it will.
Exercise \(\PageIndex{16}\)
A group of doctors is deciding whether or not to perform an operation. Suppose the null hypothesis, \(H_{0}\), is: the surgical procedure will go well. Which is the error with the greater consequence?
Exercise \(\PageIndex{17}\)
The power of a test is 0.981. What is the probability of a Type II error?
- Answer
-
0.019
Exercise \(\PageIndex{18}\)
A group of divers is exploring an old sunken ship. Suppose the null hypothesis, \(H_{0}\), is: the sunken ship does not contain buried treasure. State the Type I and Type II errors in complete sentences.
Exercise \(\PageIndex{19}\)
A microbiologist is testing a water sample for E-coli. Suppose the null hypothesis, \(H_{0}\), is: the sample does not contain E-coli. The probability that the sample does not contain E-coli, but the microbiologist thinks it does is 0.012. The probability that the sample does contain E-coli, but the microbiologist thinks it does not is 0.002. What is the power of this test?
- Answer
-
0.998
Exercise \(\PageIndex{20}\)
A microbiologist is testing a water sample for E-coli. Suppose the null hypothesis, \(H_{0}\), is: the sample contains E-coli. Which is the error with the greater consequence?
Distribution Needed for Hypothesis Testing
Exercise \(\PageIndex{21}\)
Which two distributions can you use for hypothesis testing for this chapter?
Answer
A normal distribution or a Student’s t-distribution
Exercise \(\PageIndex{22}\)
Which distribution do you use when you are testing a population mean and the standard deviation is known? Assume sample size is large.
Exercise \(\PageIndex{23}\)
Which distribution do you use when the standard deviation is not known and you are testing one population mean? Assume sample size is large.
Answer
Use a Student’s \(t\)-distribution
Exercise \(\PageIndex{24}\)
A population mean is 13. The sample mean is 12.8, and the sample standard deviation is two. The sample size is 20. What distribution should you use to perform a hypothesis test? Assume the underlying population is normal.
Exercise \(\PageIndex{25}\)
A population has a mean of 25 and a standard deviation of five. The sample mean is 24, and the sample size is 108. What distribution should you use to perform a hypothesis test?
Answer
a normal distribution for a single population mean
Exercise \(\PageIndex{26}\)
It is thought that 42% of respondents in a taste test would prefer Brand A. In a particular test of 100 people, 39% preferred Brand A. What distribution should you use to perform a hypothesis test?
Exercise \(\PageIndex{27}\)
You are performing a hypothesis test of a single population mean using a Student’s \(t\)-distribution. What must you assume about the distribution of the data?
Answer
It must be approximately normally distributed.
Exercise \(\PageIndex{28}\)
You are performing a hypothesis test of a single population mean using a Student’s \(t\)-distribution. The data are not from a simple random sample. Can you accurately perform the hypothesis test?
Exercise \(\PageIndex{29}\)
You are performing a hypothesis test of a single population proportion. What must be true about the quantities of \(np\) and \(nq\)?
Answer
They must both be greater than five.
Exercise \(\PageIndex{30}\)
You are performing a hypothesis test of a single population proportion. You find out that \(np\) is less than five. What must you do to be able to perform a valid hypothesis test?
Exercise \(\PageIndex{31}\)
You are performing a hypothesis test of a single population proportion. The data come from which distribution?
Answer
binomial distribution
Rare Events, the Sample, Decision and Conclusion
Exercise \(\PageIndex{32}\)
When do you reject the null hypothesis?
Exercise \(\PageIndex{33}\)
The probability of winning the grand prize at a particular carnival game is 0.005. Is the outcome of winning very likely or very unlikely?
Answer
The outcome of winning is very unlikely.
Exercise \(\PageIndex{34}\)
The probability of winning the grand prize at a particular carnival game is 0.005. Michele wins the grand prize. Is this considered a rare or common event? Why?
Exercise \(\PageIndex{35}\)
It is believed that the mean height of high school students who play basketball on the school team is 73 inches with a standard deviation of 1.8 inches. A random sample of 40 players is chosen. The sample mean was 71 inches, and the sample standard deviation was 1.5 years. Do the data support the claim that the mean height is less than 73 inches? The \(p\)-value is almost zero. State the null and alternative hypotheses and interpret the \(p\)-value.
Answer
\(H_{0}: \mu \geq 73\)
\(H_{a}: \mu \leq 73\)
The \(p\)-value is almost zero, which means there is sufficient data to conclude that the mean height of high school students who play basketball on the school team is less than 73 inches at the 5% level. The data do support the claim.
Exercise \(\PageIndex{36}\)
The mean age of graduate students at a University is at most 31 years with a standard deviation of two years. A random sample of 15 graduate students is taken. The sample mean is 32 years and the sample standard deviation is three years. Are the data significant at the 1% level? The \(p\)-value is 0.0264. State the null and alternative hypotheses and interpret the p-value.
Exercise \(\PageIndex{37}\)
Does the shaded region represent a low or a high \(p\)-value compared to a level of significance of 1%?
Answer
The shaded region shows a low \(p\)-value.
Exercise \(\PageIndex{38}\)
What should you do when \(\alpha > p\text{-value}\)?
Exercise \(\PageIndex{39}\)
What should you do if \(\alpha = p\text{-value}\)?
Answer
Do not reject \(H_{0}\).
Exercise \(\PageIndex{40}\)
If you do not reject the null hypothesis, then it must be true. Is this statement correct? State why or why not in complete sentences.
Use the following information to answer the next seven exercises: Suppose that a recent article stated that the mean time spent in jail by a first-time convicted burglar is 2.5 years. A study was then done to see if the mean time has increased in the new century. A random sample of 26 first-time convicted burglars in a recent year was picked. The mean length of time in jail from the survey was three years with a standard deviation of 1.8 years. Suppose that it is somehow known that the population standard deviation is 1.5. Conduct a hypothesis test to determine if the mean length of jail time has increased. Assume the distribution of the jail times is approximately normal.
Exercise \(\PageIndex{41}\)
Is this a test of means or proportions?
Answer
means
Exercise \(\PageIndex{42}\)
What symbol represents the random variable for this test?
Exercise \(\PageIndex{43}\)
In words, define the random variable for this test.
Answer
the mean time spent in jail for 26 first time convicted burglars
Exercise \(\PageIndex{44}\)
Is the population standard deviation known and, if so, what is it?
Exercise \(\PageIndex{45}\)
Calculate the following:
- \(\bar{x}\) _______
- \(\sigma\) _______
- \(s_{x}\) _______
- \(n\) _______
Answer
- 3
- 1.5
- 1.8
- 26
Exercise \(\PageIndex{46}\)
Since both \(\sigma\) and \(s_{x}\) are given, which should be used? In one to two complete sentences, explain why.
Exercise \(\PageIndex{47}\)
State the distribution to use for the hypothesis test.
Answer
\(\bar{X} - N\left(2.5, \frac{1.5}{\sqrt{26}}\right)\)
Exercise \(\PageIndex{48}\)
A random survey of 75 death row inmates revealed that the mean length of time on death row is 17.4 years with a standard deviation of 6.3 years. Conduct a hypothesis test to determine if the population mean time on death row could likely be 15 years.
- Is this a test of one mean or proportion?
- State the null and alternative hypotheses.
\(H{0}\): ____________________ \(H_{a}\): ____________________ - Is this a right-tailed, left-tailed, or two-tailed test?
- What symbol represents the random variable for this test?
- In words, define the random variable for this test.
- Is the population standard deviation known and, if so, what is it?
- Calculate the following:
- \(\bar{x}\) = _____________
- \(s\) = ____________
- \(n\) = ____________
- Which test should be used?
- State the distribution to use for the hypothesis test.
- Find the \(p\)-value.
- At a pre-conceived \(\alpha = 0.05\), what is your:
- Decision:
- Reason for the decision:
- Conclusion (write out in a complete sentence):