
6.3E: Using the Normal Distribution (Exercises)
- Page ID
- 22214

Exercise \(\PageIndex{7}\)
How would you represent the area to the left of one in a probability statement?
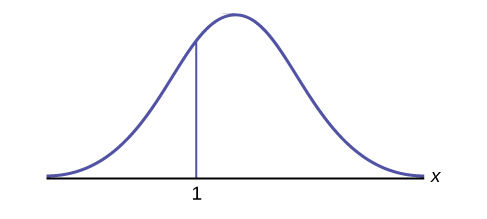
Answer
\(P(x < 1)\)
Exercise \(\PageIndex{8}\)
Is \(P(x < 1)\) equal to \(P(x \leq 1)\)? Why?
Answer
Yes, because they are the same in a continuous distribution: \(P(x = 1) = 0\)
Exercise \(\PageIndex{9}\)
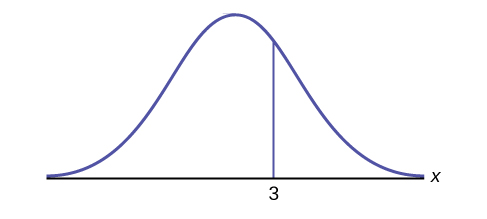
How would you represent the area to the left of three in a probability statement?
Exercise \(\PageIndex{10}\)
What is the area to the right of three?
Answer
\(1 – P(x < 3)\) or \(P(x > 3)\)
Exercise \(\PageIndex{11}\)
If the area to the left of \(x\) in a normal distribution is 0.123, what is the area to the right of \(x\)?
Exercise \(\PageIndex{12}\)
If the area to the right of \(x\) in a normal distribution is 0.543, what is the area to the left of \(x\)?
Answer
\(1 - 0.543 = 0.457\)
Use the following information to answer the next four exercises:
\(X \sim N(54, 8)\)
Exercise \(\PageIndex{13}\)
Find the probability that \(x > 56\).
Exercise \(\PageIndex{14}\)
Find the probability that \(x < 30\).
Answer
0.0013
Exercise \(\PageIndex{15}\)
Find the 80th percentile.
Exercise \(\PageIndex{16}\)
Find the 60th percentile.
Answer
56.03
Exercise \(\PageIndex{17}\)
\(X \sim N(6, 2)\)
Find the probability that \(x\) is between three and nine.
Exercise \(\PageIndex{18}\)
\(X \sim N(–3, 4)\)
Find the probability that \(x\) is between one and four.
Answer
0.1186
Exercise \(\PageIndex{19}\)
\(X \sim N(4, 5)\)
Find the maximum of \(x\) in the bottom quartile.
Exercise \(\PageIndex{20}\)
Use the following information to answer the next three exercise: The life of Sunshine CD players is normally distributed with a mean of 4.1 years and a standard deviation of 1.3 years. A CD player is guaranteed for three years. We are interested in the length of time a CD player lasts. Find the probability that a CD player will break down during the guarantee period.
- Sketch the situation. Label and scale the axes. Shade the region corresponding to the probability.
Figure \(\PageIndex{12}\).
\(P(0 < x <\) ____________\() =\) ___________ (Use zero for the minimum value of \(x\).)
Answer
- Check student’s solution.
- 3, 0.1979
Exercise \(\PageIndex{21}\)
Find the probability that a CD player will last between 2.8 and six years.
- Sketch the situation. Label and scale the axes. Shade the region corresponding to the probability.
Figure \(\PageIndex{13}\).
\(P(\)__________ \(< x <\) __________\()\) = __________
Exercise \(\PageIndex{22}\)
Find the 70th percentile of the distribution for the time a CD player lasts.
- Sketch the situation. Label and scale the axes. Shade the region corresponding to the lower 70%.
Figure \(\PageIndex{14}\).
\(P(x < k) =\) __________ Therefore, \(k =\) _________
Answer
- Check student’s solution.
- 0.70, 4.78 years
Contributors and Attributions
Barbara Illowsky and Susan Dean (De Anza College) with many other contributing authors. Content produced by OpenStax College is licensed under a Creative Commons Attribution License 4.0 license. Download for free at http://cnx.org/contents/30189442-699...b91b9de@18.114.