
4.3: Types of Studies
- Page ID
- 20850
\( \newcommand{\vecs}[1]{\overset { \scriptstyle \rightharpoonup} {\mathbf{#1}} } \)
\( \newcommand{\vecd}[1]{\overset{-\!-\!\rightharpoonup}{\vphantom{a}\smash {#1}}} \)
\( \newcommand{\dsum}{\displaystyle\sum\limits} \)
\( \newcommand{\dint}{\displaystyle\int\limits} \)
\( \newcommand{\dlim}{\displaystyle\lim\limits} \)
\( \newcommand{\id}{\mathrm{id}}\) \( \newcommand{\Span}{\mathrm{span}}\)
( \newcommand{\kernel}{\mathrm{null}\,}\) \( \newcommand{\range}{\mathrm{range}\,}\)
\( \newcommand{\RealPart}{\mathrm{Re}}\) \( \newcommand{\ImaginaryPart}{\mathrm{Im}}\)
\( \newcommand{\Argument}{\mathrm{Arg}}\) \( \newcommand{\norm}[1]{\| #1 \|}\)
\( \newcommand{\inner}[2]{\langle #1, #2 \rangle}\)
\( \newcommand{\Span}{\mathrm{span}}\)
\( \newcommand{\id}{\mathrm{id}}\)
\( \newcommand{\Span}{\mathrm{span}}\)
\( \newcommand{\kernel}{\mathrm{null}\,}\)
\( \newcommand{\range}{\mathrm{range}\,}\)
\( \newcommand{\RealPart}{\mathrm{Re}}\)
\( \newcommand{\ImaginaryPart}{\mathrm{Im}}\)
\( \newcommand{\Argument}{\mathrm{Arg}}\)
\( \newcommand{\norm}[1]{\| #1 \|}\)
\( \newcommand{\inner}[2]{\langle #1, #2 \rangle}\)
\( \newcommand{\Span}{\mathrm{span}}\) \( \newcommand{\AA}{\unicode[.8,0]{x212B}}\)
\( \newcommand{\vectorA}[1]{\vec{#1}} % arrow\)
\( \newcommand{\vectorAt}[1]{\vec{\text{#1}}} % arrow\)
\( \newcommand{\vectorB}[1]{\overset { \scriptstyle \rightharpoonup} {\mathbf{#1}} } \)
\( \newcommand{\vectorC}[1]{\textbf{#1}} \)
\( \newcommand{\vectorD}[1]{\overrightarrow{#1}} \)
\( \newcommand{\vectorDt}[1]{\overrightarrow{\text{#1}}} \)
\( \newcommand{\vectE}[1]{\overset{-\!-\!\rightharpoonup}{\vphantom{a}\smash{\mathbf {#1}}}} \)
\( \newcommand{\vecs}[1]{\overset { \scriptstyle \rightharpoonup} {\mathbf{#1}} } \)
\(\newcommand{\longvect}{\overrightarrow}\)
\( \newcommand{\vecd}[1]{\overset{-\!-\!\rightharpoonup}{\vphantom{a}\smash {#1}}} \)
\(\newcommand{\avec}{\mathbf a}\) \(\newcommand{\bvec}{\mathbf b}\) \(\newcommand{\cvec}{\mathbf c}\) \(\newcommand{\dvec}{\mathbf d}\) \(\newcommand{\dtil}{\widetilde{\mathbf d}}\) \(\newcommand{\evec}{\mathbf e}\) \(\newcommand{\fvec}{\mathbf f}\) \(\newcommand{\nvec}{\mathbf n}\) \(\newcommand{\pvec}{\mathbf p}\) \(\newcommand{\qvec}{\mathbf q}\) \(\newcommand{\svec}{\mathbf s}\) \(\newcommand{\tvec}{\mathbf t}\) \(\newcommand{\uvec}{\mathbf u}\) \(\newcommand{\vvec}{\mathbf v}\) \(\newcommand{\wvec}{\mathbf w}\) \(\newcommand{\xvec}{\mathbf x}\) \(\newcommand{\yvec}{\mathbf y}\) \(\newcommand{\zvec}{\mathbf z}\) \(\newcommand{\rvec}{\mathbf r}\) \(\newcommand{\mvec}{\mathbf m}\) \(\newcommand{\zerovec}{\mathbf 0}\) \(\newcommand{\onevec}{\mathbf 1}\) \(\newcommand{\real}{\mathbb R}\) \(\newcommand{\twovec}[2]{\left[\begin{array}{r}#1 \\ #2 \end{array}\right]}\) \(\newcommand{\ctwovec}[2]{\left[\begin{array}{c}#1 \\ #2 \end{array}\right]}\) \(\newcommand{\threevec}[3]{\left[\begin{array}{r}#1 \\ #2 \\ #3 \end{array}\right]}\) \(\newcommand{\cthreevec}[3]{\left[\begin{array}{c}#1 \\ #2 \\ #3 \end{array}\right]}\) \(\newcommand{\fourvec}[4]{\left[\begin{array}{r}#1 \\ #2 \\ #3 \\ #4 \end{array}\right]}\) \(\newcommand{\cfourvec}[4]{\left[\begin{array}{c}#1 \\ #2 \\ #3 \\ #4 \end{array}\right]}\) \(\newcommand{\fivevec}[5]{\left[\begin{array}{r}#1 \\ #2 \\ #3 \\ #4 \\ #5 \\ \end{array}\right]}\) \(\newcommand{\cfivevec}[5]{\left[\begin{array}{c}#1 \\ #2 \\ #3 \\ #4 \\ #5 \\ \end{array}\right]}\) \(\newcommand{\mattwo}[4]{\left[\begin{array}{rr}#1 \amp #2 \\ #3 \amp #4 \\ \end{array}\right]}\) \(\newcommand{\laspan}[1]{\text{Span}\{#1\}}\) \(\newcommand{\bcal}{\cal B}\) \(\newcommand{\ccal}{\cal C}\) \(\newcommand{\scal}{\cal S}\) \(\newcommand{\wcal}{\cal W}\) \(\newcommand{\ecal}{\cal E}\) \(\newcommand{\coords}[2]{\left\{#1\right\}_{#2}}\) \(\newcommand{\gray}[1]{\color{gray}{#1}}\) \(\newcommand{\lgray}[1]{\color{lightgray}{#1}}\) \(\newcommand{\rank}{\operatorname{rank}}\) \(\newcommand{\row}{\text{Row}}\) \(\newcommand{\col}{\text{Col}}\) \(\renewcommand{\row}{\text{Row}}\) \(\newcommand{\nul}{\text{Nul}}\) \(\newcommand{\var}{\text{Var}}\) \(\newcommand{\corr}{\text{corr}}\) \(\newcommand{\len}[1]{\left|#1\right|}\) \(\newcommand{\bbar}{\overline{\bvec}}\) \(\newcommand{\bhat}{\widehat{\bvec}}\) \(\newcommand{\bperp}{\bvec^\perp}\) \(\newcommand{\xhat}{\widehat{\xvec}}\) \(\newcommand{\vhat}{\widehat{\vvec}}\) \(\newcommand{\uhat}{\widehat{\uvec}}\) \(\newcommand{\what}{\widehat{\wvec}}\) \(\newcommand{\Sighat}{\widehat{\Sigma}}\) \(\newcommand{\lt}{<}\) \(\newcommand{\gt}{>}\) \(\newcommand{\amp}{&}\) \(\definecolor{fillinmathshade}{gray}{0.9}\)Most studies can be categorized as an observational study or as an experiment.
Observational Studies
An observational study starts with selecting a representative sample from a population. The researcher then takes measurements from the sample, but does not manipulate any of the variables with treatments. The goal of an observational study is to interpret and analyze the measured variables, but it is not possible to show a cause and effect relationship.
Example: GPA and missing class
A group of students at Georgia College conducted a survey asking random students various questions about their academic profile. One part of their study was to see if there is any correlation between various students’ GPA and classes missed.
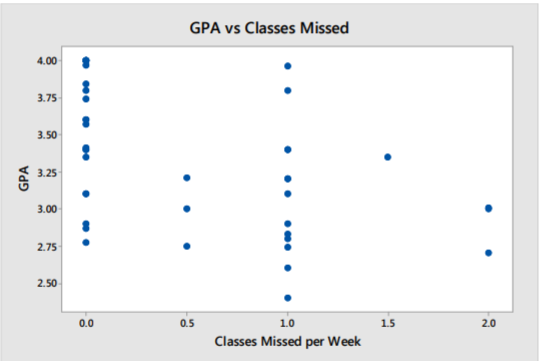
In this observational study, there is no attempt by the researchers to manipulate any variables. The conclusion was that there is a weak correlation between GPA and classes missed, but there is basis for concluding that missing class lowers GPA.
Experiments
An experiment starts with a representative sample from a population. The researcher will then randomly break this sample into groups and then apply treatments in order to manipulate a variable of interest. The goal of an experiment is to find a cause and effect relationship between a random variable in the population and the variable manipulated by the researcher. If an experiment is conducted properly, the researcher can control for confounding or lurking variables and test for a placebo effect.
Example: Electronic gaming machines42
The following study was published in the Journal of Addictive Behaviors in 2012:
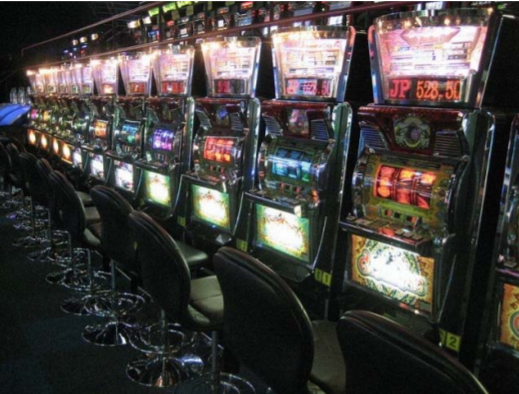
Electronic gaming machines (EGM) may be a particularly addictive form of gambling, and gambling speed is believed to contribute to the addictive potential of such machines. The aim of this study was to generate more knowledge concerning speed as a structural characteristic in gambling, by comparing the effects of three different bet‐to‐outcome intervals (BOI) on gamblers bet‐sizes, game evaluations and illusion of control during gambling on a computer simulated slot machine. Furthermore, the researchers investigated whether problem gambling moderates effects of BOI on gambling behavior and cognitions.
62 participants played a computerized slot machine with either fast (400 ms), medium (1700 ms) or slow (3000 ms) BOI. SOGS‐R was used to measure pre‐existing gambling problems. Mean bet size, game evaluations and illusion of control comprised the dependent variables.
Gambling speed had no overall effect on either mean bet size, game evaluations or illusion of control, but in the fast machines, at‐risk gamblers employed higher bet sizes compared to no‐risk gamblers.
The findings corroborate and elaborate on previous studies and indicate that restrictions on gambling speed may serve as a harm reducing effort for at‐risk gamblers. 43
In this experiment, the researchers controlled one variable, the speed of the electronic gaming machine. They then measured the variable they did not control, the bet size made by the problem gambler. Because the researchers controlled the experiment, they established a cause and effect relationship and concluded that the speed of these machines will increase the bet size.
Explanatory and response variables
When conducting an experiment, the goal is to show a cause and effect relationship between an explanatory variable the researcher controls and a response variable that is observed or measured.
Variables in an Experiment
Definition: Explanatory Variable
The variable that is controlled or manipulated by the researcher.
Definition: Response Variable
The variable which is being measured and is the focus of the study.
The researcher tries to answer the question: "Does the explanatory variable (cause) affect the response variable (effect)?
Example: Blue jean tensile strength

"Denim trousers, commonly known as “blue jeans”44, have maintained their popularity for many years. For the purpose of supporting customers’ purchasing behavior and to address their aesthetic taste, companies have been trying in recent years to develop various techniques to improve the visual aspects of denim fabrics. These techniques mainly include printing on fabrics, embroidery and washing the final product. Especially, fraying certain areas of the fabric by sanding and stone washing to create designs is a popular technique. However, due to certain inconveniences caused by these procedures and in response to growing demands, research is underway to obtain a similar appearance by creating better quality and more advantageous manufacturing conditions."45
Traditionally, this extra process was done by manual cutting and stitching. A new process using a laser beam to transfer these images is being tested to see if there is a difference in tensile strength as measured in pounds per square inch (psi).
The researchers use random assignment on 40 pairs of jeans, with each group receiving 20 pairs of jeans. Each pair of jeans was then tested in 3 different places, so a total of 60 measurements were taken for the manual method and 60 measurements for the laser method.
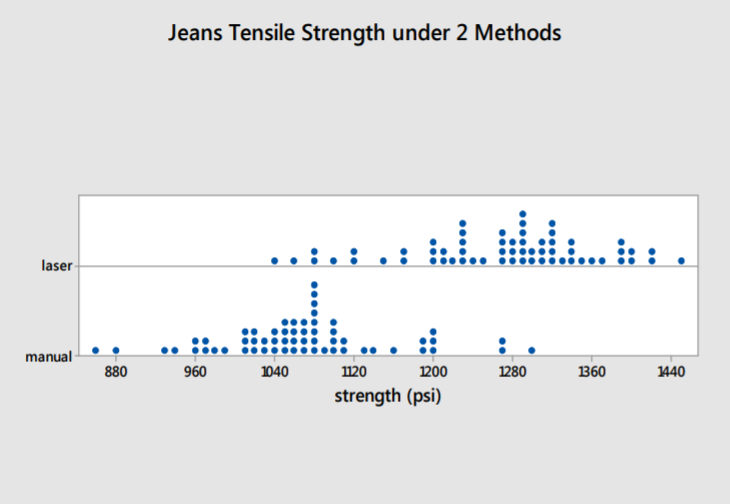
The dot plot shows the values of each of these methods.
Based on these results, the researchers concluded that blue jeans made using the laser method were stronger than blue jeans manufactured under the manual method.
The explanatory variable is the production method (manual or laser), which is the variable that is controlled by the researcher, randomly assigning jeans into the two groups.
The response variable, which is the variable the researcher wanted to compare for each method of production, is the tensile strength of each measurement taken from the jeans.
Let's now organize this study into the steps of the statistical process.
| 1: Ask a question that can be answered with sample data. | Is there a difference in tensile strength of denim blue jeans between the manual method and the laser method of modification? |
| 2: Determine what information is needed. | The method of production (manual or laser), The tensile strength of each sample |
| 3: Collect sample data that is representative of the population. | The researchers used random assignment to control for confounding variables, such as defects in the fabric. 60 measurements were taken for each method. |
| 4: Summarize, interpret and analyze the sample data. | Reviewing the dot plots of tensile strength under reach method, both graphs have the spread and shape, but the center for the laser method is substantial higher than the graph for the manual method. |
| 5: State the results and conclusion of the study. | The laser method produces blue jeans with higher tensile strength compared to the manual method. |
Placebos and Blinding
Sometimes in an experiment, a participant will respond in a positive way to a treatment with no active ingredients. This called the placebo effect, and a treatment with no active ingredients is called a placebo.
Example: Headache Pill
A researcher for a pharmaceutical company is conducting research on an experimental drug to reduce the pain from migraine headaches. Participants with migraine headaches are randomly split into 3 groups. The first group gets the experimental drug (Treatment Group). The second group gets a placebo, a fake drug (Placebo Group). The third group gets nothing (Control Group).
The researcher found that pain was reduced for both the treatment group and the placebo group, establishing a placebo effect. The researcher must then compare the amount of pain reduction in the treatment group to the placebo group in order to determine if the treatment was effective.
The best method of conducting an experiment is to implement blinding. A single blind study is where the participant does not know whether the treatment is real or a placebo. A double blind study is where neither the administrator of the treatment nor the participant knows whether the treatment is real or a placebo.
In the headache pill example, the researcher implemented a double blind study to minimize the chance that the participant knows what type of drug is being administered.
Some experiments cannot be blinded. For example, if you wanted to study for a difference in health benefits between daily 30 minute walks or a 30 minute runs, it would be impossible to blind the participants since they know the difference between a walk and run.