
6.1: Uniform Distribution
- Page ID
- 5192

\( \newcommand{\vecs}[1]{\overset { \scriptstyle \rightharpoonup} {\mathbf{#1}} } \)
\( \newcommand{\vecd}[1]{\overset{-\!-\!\rightharpoonup}{\vphantom{a}\smash {#1}}} \)
\( \newcommand{\dsum}{\displaystyle\sum\limits} \)
\( \newcommand{\dint}{\displaystyle\int\limits} \)
\( \newcommand{\dlim}{\displaystyle\lim\limits} \)
\( \newcommand{\id}{\mathrm{id}}\) \( \newcommand{\Span}{\mathrm{span}}\)
( \newcommand{\kernel}{\mathrm{null}\,}\) \( \newcommand{\range}{\mathrm{range}\,}\)
\( \newcommand{\RealPart}{\mathrm{Re}}\) \( \newcommand{\ImaginaryPart}{\mathrm{Im}}\)
\( \newcommand{\Argument}{\mathrm{Arg}}\) \( \newcommand{\norm}[1]{\| #1 \|}\)
\( \newcommand{\inner}[2]{\langle #1, #2 \rangle}\)
\( \newcommand{\Span}{\mathrm{span}}\)
\( \newcommand{\id}{\mathrm{id}}\)
\( \newcommand{\Span}{\mathrm{span}}\)
\( \newcommand{\kernel}{\mathrm{null}\,}\)
\( \newcommand{\range}{\mathrm{range}\,}\)
\( \newcommand{\RealPart}{\mathrm{Re}}\)
\( \newcommand{\ImaginaryPart}{\mathrm{Im}}\)
\( \newcommand{\Argument}{\mathrm{Arg}}\)
\( \newcommand{\norm}[1]{\| #1 \|}\)
\( \newcommand{\inner}[2]{\langle #1, #2 \rangle}\)
\( \newcommand{\Span}{\mathrm{span}}\) \( \newcommand{\AA}{\unicode[.8,0]{x212B}}\)
\( \newcommand{\vectorA}[1]{\vec{#1}} % arrow\)
\( \newcommand{\vectorAt}[1]{\vec{\text{#1}}} % arrow\)
\( \newcommand{\vectorB}[1]{\overset { \scriptstyle \rightharpoonup} {\mathbf{#1}} } \)
\( \newcommand{\vectorC}[1]{\textbf{#1}} \)
\( \newcommand{\vectorD}[1]{\overrightarrow{#1}} \)
\( \newcommand{\vectorDt}[1]{\overrightarrow{\text{#1}}} \)
\( \newcommand{\vectE}[1]{\overset{-\!-\!\rightharpoonup}{\vphantom{a}\smash{\mathbf {#1}}}} \)
\( \newcommand{\vecs}[1]{\overset { \scriptstyle \rightharpoonup} {\mathbf{#1}} } \)
\(\newcommand{\longvect}{\overrightarrow}\)
\( \newcommand{\vecd}[1]{\overset{-\!-\!\rightharpoonup}{\vphantom{a}\smash {#1}}} \)
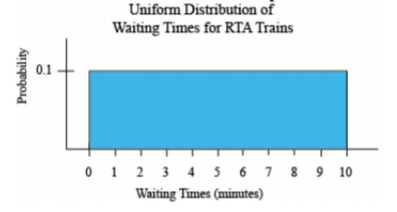
\(\newcommand{\avec}{\mathbf a}\) \(\newcommand{\bvec}{\mathbf b}\) \(\newcommand{\cvec}{\mathbf c}\) \(\newcommand{\dvec}{\mathbf d}\) \(\newcommand{\dtil}{\widetilde{\mathbf d}}\) \(\newcommand{\evec}{\mathbf e}\) \(\newcommand{\fvec}{\mathbf f}\) \(\newcommand{\nvec}{\mathbf n}\) \(\newcommand{\pvec}{\mathbf p}\) \(\newcommand{\qvec}{\mathbf q}\) \(\newcommand{\svec}{\mathbf s}\) \(\newcommand{\tvec}{\mathbf t}\) \(\newcommand{\uvec}{\mathbf u}\) \(\newcommand{\vvec}{\mathbf v}\) \(\newcommand{\wvec}{\mathbf w}\) \(\newcommand{\xvec}{\mathbf x}\) \(\newcommand{\yvec}{\mathbf y}\) \(\newcommand{\zvec}{\mathbf z}\) \(\newcommand{\rvec}{\mathbf r}\) \(\newcommand{\mvec}{\mathbf m}\) \(\newcommand{\zerovec}{\mathbf 0}\) \(\newcommand{\onevec}{\mathbf 1}\) \(\newcommand{\real}{\mathbb R}\) \(\newcommand{\twovec}[2]{\left[\begin{array}{r}#1 \\ #2 \end{array}\right]}\) \(\newcommand{\ctwovec}[2]{\left[\begin{array}{c}#1 \\ #2 \end{array}\right]}\) \(\newcommand{\threevec}[3]{\left[\begin{array}{r}#1 \\ #2 \\ #3 \end{array}\right]}\) \(\newcommand{\cthreevec}[3]{\left[\begin{array}{c}#1 \\ #2 \\ #3 \end{array}\right]}\) \(\newcommand{\fourvec}[4]{\left[\begin{array}{r}#1 \\ #2 \\ #3 \\ #4 \end{array}\right]}\) \(\newcommand{\cfourvec}[4]{\left[\begin{array}{c}#1 \\ #2 \\ #3 \\ #4 \end{array}\right]}\) \(\newcommand{\fivevec}[5]{\left[\begin{array}{r}#1 \\ #2 \\ #3 \\ #4 \\ #5 \\ \end{array}\right]}\) \(\newcommand{\cfivevec}[5]{\left[\begin{array}{c}#1 \\ #2 \\ #3 \\ #4 \\ #5 \\ \end{array}\right]}\) \(\newcommand{\mattwo}[4]{\left[\begin{array}{rr}#1 \amp #2 \\ #3 \amp #4 \\ \end{array}\right]}\) \(\newcommand{\laspan}[1]{\text{Span}\{#1\}}\) \(\newcommand{\bcal}{\cal B}\) \(\newcommand{\ccal}{\cal C}\) \(\newcommand{\scal}{\cal S}\) \(\newcommand{\wcal}{\cal W}\) \(\newcommand{\ecal}{\cal E}\) \(\newcommand{\coords}[2]{\left\{#1\right\}_{#2}}\) \(\newcommand{\gray}[1]{\color{gray}{#1}}\) \(\newcommand{\lgray}[1]{\color{lightgray}{#1}}\) \(\newcommand{\rank}{\operatorname{rank}}\) \(\newcommand{\row}{\text{Row}}\) \(\newcommand{\col}{\text{Col}}\) \(\renewcommand{\row}{\text{Row}}\) \(\newcommand{\nul}{\text{Nul}}\) \(\newcommand{\var}{\text{Var}}\) \(\newcommand{\corr}{\text{corr}}\) \(\newcommand{\len}[1]{\left|#1\right|}\) \(\newcommand{\bbar}{\overline{\bvec}}\) \(\newcommand{\bhat}{\widehat{\bvec}}\) \(\newcommand{\bperp}{\bvec^\perp}\) \(\newcommand{\xhat}{\widehat{\xvec}}\) \(\newcommand{\vhat}{\widehat{\vvec}}\) \(\newcommand{\uhat}{\widehat{\uvec}}\) \(\newcommand{\what}{\widehat{\wvec}}\) \(\newcommand{\Sighat}{\widehat{\Sigma}}\) \(\newcommand{\lt}{<}\) \(\newcommand{\gt}{>}\) \(\newcommand{\amp}{&}\) \(\definecolor{fillinmathshade}{gray}{0.9}\)If you have a situation where the probability is always the same, then this is known as a uniform distribution. An example would be waiting for a commuter train. The commuter trains on the Blue and Green Lines for the Regional Transit Authority (RTA) in Cleveland, OH, have a waiting time during peak hours of ten minutes ("2012 annual report," 2012). If you are waiting for a train, you have anywhere from zero minutes to ten minutes to wait. Your probability of having to wait any number of minutes in that interval is the same. This is a uniform distribution. The graph of this distribution is in Figure \(\PageIndex{1}\).
.png?revision=1)
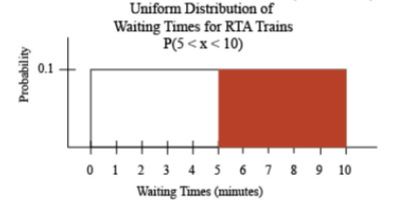
Suppose you want to know the probability that you will have to wait between five and ten minutes for the next train. You can look at the probability graphically such as in Figure \(\PageIndex{2}\).
.png?revision=1)
How would you find this probability? Calculus says that the probability is the area under the curve. Notice that the shape of the shaded area is a rectangle, and the area of a rectangle is length times width. The length is \(10-5=5\) and the width is 0.1. The probability is \(P(5<x<10)=0.1 * 5=0.5\), where and x is the waiting time during peak hours.
Example \(\PageIndex{1}\) finding probabilities in a uniform distribution
The commuter trains on the Blue and Green Lines for the Regional Transit Authority (RTA) in Cleveland, OH, have a waiting time during peak rush hour periods of ten minutes ("2012 annual report," 2012).
- State the random variable.
- Find the probability that you have to wait between four and six minutes for a train.
- Find the probability that you have to wait between three and seven minutes for a train.
- Find the probability that you have to wait between zero and ten minutes for a train.
- Find the probability of waiting exactly five minutes.
Solution
a. x = waiting time during peak hours
b. \(P(4<x<6)=(6-4)^{*} 0.1=0.2\)
c. \(P(3<x<7)=(7-3) * 0.1=0.4\)
d. \(P(0<x<10)=(10-0) * 0.1=1.0\)
e. Since this would be just one line, and the width of the line is 0, then the \(P(x=5)=0 * 0.1=0\).
Notice that in Example \(\PageIndex{1}\)d, the probability is equal to one. This is because the probability that was computed is the area under the entire curve. Just like in discrete probability distributions, where the total probability was one, the probability of the entire curve is one. This is the reason that the height of the curve is 0.1. In general, the height of a uniform distribution that ranges between a and b, is \(\dfrac{1}{b-a}\).
Homework
Exercise \(\PageIndex{1}\)
- The commuter trains on the Blue and Green Lines for the Regional Transit Authority (RTA) in Cleveland, OH, have a waiting time during peak rush hour periods of ten minutes ("2012 annual report," 2012).
- State the random variable.
- Find the probability of waiting between two and five minutes.
- Find the probability of waiting between seven and ten minutes.
- Find the probability of waiting eight minutes exactly.
- The commuter trains on the Red Line for the Regional Transit Authority (RTA) in Cleveland, OH, have a waiting time during peak rush hour periods of eight minutes ("2012 annual report," 2012).
- State the random variable.
- Find the height of this uniform distribution.
- Find the probability of waiting between four and five minutes.
- Find the probability of waiting between three and eight minutes.
- Find the probability of waiting five minutes exactly.
- Answer
-
1. a. See solutions, b. \(P(2<x<5)=0.3\), c. \(P(7<x<10)=0.3\), d. \(P(x=8)=0\)