
2.7.5: Practice with a 2x2 Factorial Design- Attention
- Page ID
- 22140

\( \newcommand{\vecs}[1]{\overset { \scriptstyle \rightharpoonup} {\mathbf{#1}} } \)
\( \newcommand{\vecd}[1]{\overset{-\!-\!\rightharpoonup}{\vphantom{a}\smash {#1}}} \)
\( \newcommand{\id}{\mathrm{id}}\) \( \newcommand{\Span}{\mathrm{span}}\)
( \newcommand{\kernel}{\mathrm{null}\,}\) \( \newcommand{\range}{\mathrm{range}\,}\)
\( \newcommand{\RealPart}{\mathrm{Re}}\) \( \newcommand{\ImaginaryPart}{\mathrm{Im}}\)
\( \newcommand{\Argument}{\mathrm{Arg}}\) \( \newcommand{\norm}[1]{\| #1 \|}\)
\( \newcommand{\inner}[2]{\langle #1, #2 \rangle}\)
\( \newcommand{\Span}{\mathrm{span}}\)
\( \newcommand{\id}{\mathrm{id}}\)
\( \newcommand{\Span}{\mathrm{span}}\)
\( \newcommand{\kernel}{\mathrm{null}\,}\)
\( \newcommand{\range}{\mathrm{range}\,}\)
\( \newcommand{\RealPart}{\mathrm{Re}}\)
\( \newcommand{\ImaginaryPart}{\mathrm{Im}}\)
\( \newcommand{\Argument}{\mathrm{Arg}}\)
\( \newcommand{\norm}[1]{\| #1 \|}\)
\( \newcommand{\inner}[2]{\langle #1, #2 \rangle}\)
\( \newcommand{\Span}{\mathrm{span}}\) \( \newcommand{\AA}{\unicode[.8,0]{x212B}}\)
\( \newcommand{\vectorA}[1]{\vec{#1}} % arrow\)
\( \newcommand{\vectorAt}[1]{\vec{\text{#1}}} % arrow\)
\( \newcommand{\vectorB}[1]{\overset { \scriptstyle \rightharpoonup} {\mathbf{#1}} } \)
\( \newcommand{\vectorC}[1]{\textbf{#1}} \)
\( \newcommand{\vectorD}[1]{\overrightarrow{#1}} \)
\( \newcommand{\vectorDt}[1]{\overrightarrow{\text{#1}}} \)
\( \newcommand{\vectE}[1]{\overset{-\!-\!\rightharpoonup}{\vphantom{a}\smash{\mathbf {#1}}}} \)
\( \newcommand{\vecs}[1]{\overset { \scriptstyle \rightharpoonup} {\mathbf{#1}} } \)
\( \newcommand{\vecd}[1]{\overset{-\!-\!\rightharpoonup}{\vphantom{a}\smash {#1}}} \)
\(\newcommand{\avec}{\mathbf a}\) \(\newcommand{\bvec}{\mathbf b}\) \(\newcommand{\cvec}{\mathbf c}\) \(\newcommand{\dvec}{\mathbf d}\) \(\newcommand{\dtil}{\widetilde{\mathbf d}}\) \(\newcommand{\evec}{\mathbf e}\) \(\newcommand{\fvec}{\mathbf f}\) \(\newcommand{\nvec}{\mathbf n}\) \(\newcommand{\pvec}{\mathbf p}\) \(\newcommand{\qvec}{\mathbf q}\) \(\newcommand{\svec}{\mathbf s}\) \(\newcommand{\tvec}{\mathbf t}\) \(\newcommand{\uvec}{\mathbf u}\) \(\newcommand{\vvec}{\mathbf v}\) \(\newcommand{\wvec}{\mathbf w}\) \(\newcommand{\xvec}{\mathbf x}\) \(\newcommand{\yvec}{\mathbf y}\) \(\newcommand{\zvec}{\mathbf z}\) \(\newcommand{\rvec}{\mathbf r}\) \(\newcommand{\mvec}{\mathbf m}\) \(\newcommand{\zerovec}{\mathbf 0}\) \(\newcommand{\onevec}{\mathbf 1}\) \(\newcommand{\real}{\mathbb R}\) \(\newcommand{\twovec}[2]{\left[\begin{array}{r}#1 \\ #2 \end{array}\right]}\) \(\newcommand{\ctwovec}[2]{\left[\begin{array}{c}#1 \\ #2 \end{array}\right]}\) \(\newcommand{\threevec}[3]{\left[\begin{array}{r}#1 \\ #2 \\ #3 \end{array}\right]}\) \(\newcommand{\cthreevec}[3]{\left[\begin{array}{c}#1 \\ #2 \\ #3 \end{array}\right]}\) \(\newcommand{\fourvec}[4]{\left[\begin{array}{r}#1 \\ #2 \\ #3 \\ #4 \end{array}\right]}\) \(\newcommand{\cfourvec}[4]{\left[\begin{array}{c}#1 \\ #2 \\ #3 \\ #4 \end{array}\right]}\) \(\newcommand{\fivevec}[5]{\left[\begin{array}{r}#1 \\ #2 \\ #3 \\ #4 \\ #5 \\ \end{array}\right]}\) \(\newcommand{\cfivevec}[5]{\left[\begin{array}{c}#1 \\ #2 \\ #3 \\ #4 \\ #5 \\ \end{array}\right]}\) \(\newcommand{\mattwo}[4]{\left[\begin{array}{rr}#1 \amp #2 \\ #3 \amp #4 \\ \end{array}\right]}\) \(\newcommand{\laspan}[1]{\text{Span}\{#1\}}\) \(\newcommand{\bcal}{\cal B}\) \(\newcommand{\ccal}{\cal C}\) \(\newcommand{\scal}{\cal S}\) \(\newcommand{\wcal}{\cal W}\) \(\newcommand{\ecal}{\cal E}\) \(\newcommand{\coords}[2]{\left\{#1\right\}_{#2}}\) \(\newcommand{\gray}[1]{\color{gray}{#1}}\) \(\newcommand{\lgray}[1]{\color{lightgray}{#1}}\) \(\newcommand{\rank}{\operatorname{rank}}\) \(\newcommand{\row}{\text{Row}}\) \(\newcommand{\col}{\text{Col}}\) \(\renewcommand{\row}{\text{Row}}\) \(\newcommand{\nul}{\text{Nul}}\) \(\newcommand{\var}{\text{Var}}\) \(\newcommand{\corr}{\text{corr}}\) \(\newcommand{\len}[1]{\left|#1\right|}\) \(\newcommand{\bbar}{\overline{\bvec}}\) \(\newcommand{\bhat}{\widehat{\bvec}}\) \(\newcommand{\bperp}{\bvec^\perp}\) \(\newcommand{\xhat}{\widehat{\xvec}}\) \(\newcommand{\vhat}{\widehat{\vvec}}\) \(\newcommand{\uhat}{\widehat{\uvec}}\) \(\newcommand{\what}{\widehat{\wvec}}\) \(\newcommand{\Sighat}{\widehat{\Sigma}}\) \(\newcommand{\lt}{<}\) \(\newcommand{\gt}{>}\) \(\newcommand{\amp}{&}\) \(\definecolor{fillinmathshade}{gray}{0.9}\)Let’s go through the process of looking at a 2x2 factorial design in the wild.
Scenario: Stand at Attention
Do you pay more attention when you are sitting or standing? This was the kind of research question the researchers were asking in the study we will look at. The research taht we are basing our calculations on is from a paper called “Stand by your Stroop: Standing up enhances selective attention and cognitive control” (Rosenbaum, Mama, & Algom, 2017), although Dr. MO tweaked the experiment to simplify ANOVA Summary Table calculations a tiny bit. This paper asked whether sitting versus standing would influence a measure of selective attention, the ability to ignore distracting information.
They used a classic test of selective attention, called the Stroop effect. In a typical Stroop experiment, participants name the color of words as fast as they can. The trick is that sometimes the color of the word is the same as the name of the word, and sometimes it is not. Some examples are in Figure \(\PageIndex{1}\). Try it yourself! It's really difficult to name the color of the word in the Incongruent condition; your brain wants to read the word, not look at the color of the letters!
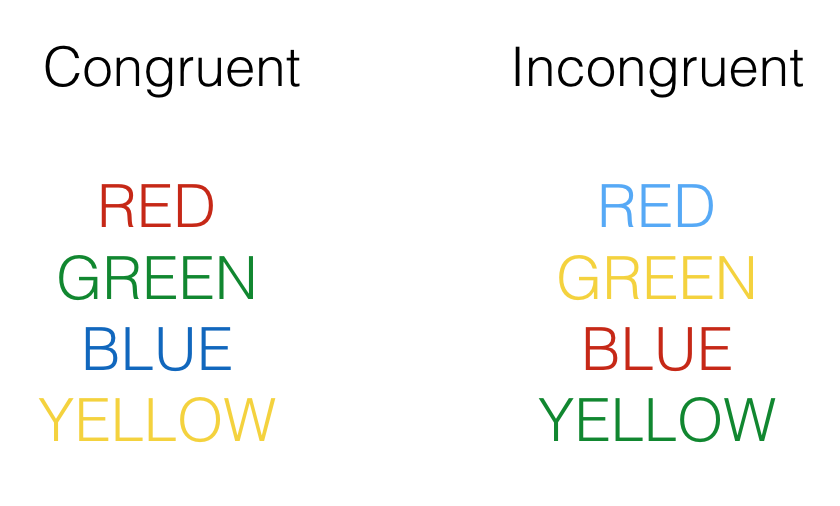
The task is to name the color of the letters. Congruent trials occur when the color and word match. So, the correct answers for each of the congruent stimuli shown would be to say, red, green, blue and yellow. Incongruent trials occur when the color and word mismatch. The correct answers for each of the incongruent stimuli would be: blue, yellow, red, green.
The Stroop effect is an example of a well-known phenomena. What happens is that people are faster to name the color of the congruent items compared to the color of the incongruent items. This difference (incongruent reaction time - congruent reaction time) is called the Stroop effect.
Many researchers argue that the Stroop effect measures something about selective attention, the ability to ignore distracting information. If this theory is true, Dr. MO is very bad at ignoring distracting information! In the Stroop task, the target information that you need to pay attention to is the color of the word, not the word itself. For each item, the word itself is distracting, it is not the information that you are supposed to respond to. However, it seems that most people can’t help but notice the word, and their performance in the color-naming task is subsequently influenced by the presence of the distracting word.
People who are good at ignoring the distracting words should have small Stroop effects. They will ignore the word, and it won’t influence them very much for either congruent or incongruent trials. As a result, the difference in performance (the Stroop effect) should be fairly small if you have “good” selective attention in this task. People who are bad at ignoring the distracting words should have big Stroop effects. They will not ignore the words, causing them to be relatively fast when the word names the color of the letters, and relatively slow when the word mismatches. As a result, they will show a difference in performance between the incongruent and congruent conditions.
If we take the size of the Stroop effect as a measure of selective attention, we can then start wondering what sorts of things improve selective attention (e.g., that make the Stroop effect smaller), and what kinds of things impair selective attention (e.g., make the Stroop effect bigger).
The research question of this study was to ask whether standing up improves selective attention compared to sitting down. They predicted smaller Stroop effects when people were standing up and doing the task, compared to when they were sitting down and doing the task.
Let's start by seeing if you understand the scenario.
Answer the following questions to understand the variables and groups that we are working with.
- What are the IVs and their levels?
- What is the DV (quantitative variable being measured)?
- Is this a 2x2 factorial design? If not, what kind of design is it?
- List out each of the combinations of the levels of the IVs.
- Answer
-
- One IV is whether the color of the letters and the word are congruent or incongruent; let's call that one Congruency. The other IV is whether the participants were standing or sitting, and we can call that Posture.
- The DV is how long it took participants to name the color. This was probably measured in milliseconds.
- Yes, this is a 2x2 factorial design because there are two IVs (two numbers) and each IV has two levels (each number is a "2").
- Because 2x2 = 4, we will have four combinations:
- Congruent color while standing
- Congruent color while sitting
- Incongruent color while standing
- Incomgruent color while sitting
Step 1. State the Hypothesis
They had participants perform many individual trials responding to single Stroop stimuli, both congruent and incongruent. And they had participants stand up sometimes and do it, and sit-down sometimes and do it. Figure \(\PageIndex{2}\) is a bar graph of the means.
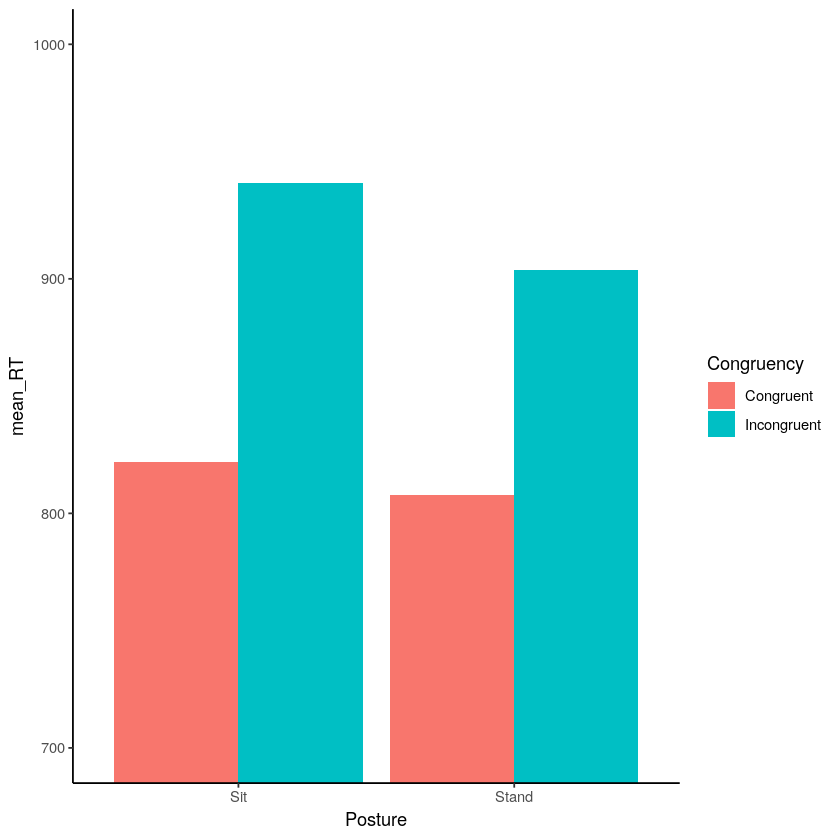
We can see in Figure \(\PageIndex{2}\) that Stroop effects were observed in both the sitting position and the standing position because it took participants longer to respond when the word was incongruent with the color of the letters. In the sitting position, mean congruent reaction times (RT) were shorter than mean incongruent RTs (the red bar on the left of each pair is lower than the aqua bar on the right of each pair). The same general pattern is observed for the standing position.
Based on these means, what do you predict for your research hypotheses? Will there be a main effect for Congruency? A main effect for posture? An interaction of Congruency and Posture?
Use the information in Figure \(\PageIndex{2}\) to describe any main effects or interaction that you predict (in words only). Make sure that you predict the direction of effects by naming which group will have shorter reaction times.
Solution
Looking at the set of two differently colored bars, Dr. MO predicts that there will be a main effect of Congruency such that participants will react faster (smaller reaction time) when the words and colors match (Congruent) than when they do not match (Incongruent).
Trying to look at only Posture (sort "averaging" the pairs of bars in my head, Dr. MO predicts that there may be a main effect of Posture, too, such that participants react faster while standing rather than sitting. [Note to readers: This is not at all clear in the data or in the way that the data is presented, but that's why it's a hypothesis, an educated guess!]
Is there an interaction? Dr. MO would say yes, reaction time seems to be even faster for congruent words when standing than sitting, with participants with incongruent words while sitting being particularly slow to react to.
Research hypothesis are pretty complex when ther are more than two IVs. Researchers have prior reserach and theory that often suggests one specific interaction to expect. Being new to statistics and new to this field of selective attention, we are sorta going in blind.
What about null hypotheses? We still have those in factorial designs!
What are the null hypotheses for this scenario (in words)?
- Answer
-
You could simply state that all means will be similar.
If it makes more sense to you to mirror the research hypotheses, you can also list out the main effects and interaction:
- The null hypothesis for Congruency is that the mean reaction time for the congruent condition will be similar as the reaction time for the incongruent condition.
- The null hypothesis for Posture is that the mean reaction time while sitting will be similar as the reaction time while standing.
- The null hypothesis for the interactoin is that the average reaction for Congruency and Posture combined will be similar. [You could list out all of the combinations here again, too.]
Step 2. Find the Critical Values
You are welcome to complete this step after you've completed the ANOVA Summary Table so that we have all of the necessary Degrees of Freedom, but we'll use the formulas for Degrees of Freedom to do that now.
Formulas for Degrees of Freedom
- Cells: \((k_1 \times k_2) – 1\)
- Remembering that “k” is the number of groups, k1 is the number of levels of the first IV and , k2 is the number of levels of the other IV.
- Between group for one variable (IV11): \(k_1 – 1\)
- Between group for the other variable (IV2): \(k_2 – 1\)
- Interaction: \(df_1 \times df_2\)
- Within group: \(df_{Total} – df_{Cells}\)
- Total: \(N-1\)
- With N being the number of scores.
What are the Degrees of Freedom for each of the six sources if N = 50?
- Answer
-
- Cells: \((k_1 \times k_2) – 1 = (2 \times 2) - 1 = 4 - 1 = 3 \)
- Between group for one variable (IV11): \(k_1 – 1 = 2 -1 = 1 \)
- Between group for the other variable (IV2) \(k_2) – 1 = 2 - 1 = 1 \)
- Interaction: \(df_1 \times df_2 = 1 \times 1 = 1\)
- Notice that we are multiplying the Degrees of Freedom of each, not k! It's so easy to get confused...
- Within group: \(df_{Total} – df_{Cells} = 49 - 3 = 46 \)
- You have to find the Degrees of Freedom for the Total (#6 here) before you can find this one.
- Total: \(N-1 = 50 - 1 = 49\)
- Cells: \((k_1 \times k_2) – 1 = (2 \times 2) - 1 = 4 - 1 = 3 \)
Well, that was a lot!
Now, let's use these to find the critical values.
Using the Table of Critical F-Scores, what are the critical values of F for p=0.05 for:
- Main Effect of IV 1 (Congruency)?
- Main Effect of IV 2 (Posture)?
- Interaction?
- Answer
-
- Main Effect of IV 1 (Congruency) = Using the Degrees of Freedom of the numerator (IV 1) and the denominator (WG), \(F_{Crit} (1, 46) = 4.08\) (if you round down) or 4.03 (if you find the nearest df of the denominator).
- Main Effect of IV 2 (Posture) = Using the Degrees of Freedom of the numerator (IV 2) and the denominator (WG), \(F_{Crit} (1, 46) = 4.08\) (if you round down) or 4.03 (if you find the nearest df of the denominator).
- Interaction = Using the Degrees of Freedom of the numerator (Interaction) and the denominator (WG), \(F_{Crit} (1, 46) = 4.08\) (if you round down) or 4.03 (if you find the nearest df of the denominator).
Step 3: Compute the Test Statistic
We'll complete an ANOVA Summary to whether the differences in the means are likely or unlikely to be due to chance. The ANOVA Summary Table will give us main effects for Congruency and Posture (the two IVs), as well as one interaction effect to evaluate (Congruency X Posture). The interaction effect tells us whether the congruency effect changes across the levels of the posture manipulation.
| Source | \(SS\) | \(df\) | \(MS\) | \(F\) |
|---|---|---|---|---|
| IV 1 | 576,821.64 | |||
| IV 2 | 32,303.45 | |||
| Interaction | 6,560.34 | |||
| Within Groups (Error) | 35,859.07 | |||
| Total | 651,544.50 |
Use the Sum of Squares provided in Table \(\PageIndex{1}\) to fill in the rest of the ANOVA Summary Table in Table \(\PageIndex{2}\).
Solution
| Source | SS | df | MS | F |
|---|---|---|---|---|
| IV 1 | 576,821.64 | \(k_1 - 1 \) = 2 - 1 1 |
\( \dfrac{SS_1}{df_1} = \dfrac{576821.64}{1}\) |
\( \dfrac{MS_{1}}{MS_{WG}} = \dfrac{576821.64}{779.55}\) |
| IV 2 | 32,303.45 | \(k_2 - 1 \) = 2 - 1 = 1 |
\( \dfrac{SS_2}{df_2} = \dfrac{35303.45}{1}\) |
\( \dfrac{MS_{2}}{MS_{WG}} = \dfrac{32303.45}{779.55}\) |
| Interaction | 6,560.34 | \(df_1 \times df_2 \) = 1 * 1 = 1 |
\( \dfrac{SS_{INT}}{df_{INT}} = \dfrac{6560.34}{1}\) |
\( \dfrac{MS_{Interaction}}{MS_{WG}} = \dfrac{6560.34}{779.55}\) |
| Within Groups (Error) | 35,859.07 | \(df_{Total} - df_{cells} \) = 49 - 3 = 46 |
\( \dfrac{SS_{WG}}{df_{WG}} = \dfrac{35859.07}{46}\) |
N/A |
| Total | 651,544.50 | \(N-1 = 50 - 1 = 49\) | N/A | N/A |
To complete the table, you need to need to calculate the degrees of freedom of cells \((df_{cells} = (k1 \times k2) – 1)\) although there’s no place in the table to include this information:
\[\begin{aligned} {df_{cells}} &= (k_1 * k_2) – 1 \\ df_{cells} &=(2 * 2) - 1 \\ df_{cells} &= 4 -1 \\ df_{cells} &=3 \end{aligned} \nonumber \]
That wasn't so hard! Now, let's figure out what this all means.
Step 4. Make the Decision
To make the decision, we need to compare each calculated F-score to the critical values that we found in Step 2.
For each calculated F (main effect for IV 1, main effect for IV 2, interaction), decide if the null hypothesis should be retained or rejected.
(Critical \(<\) Calculated) \(=\) Reject null \(=\) At least one mean is different from at least one other mean. \(= p<.05\)
(Critical \(>\) Calculated) \(=\) Retain null \(=\) All of the means are similar. \(= p>.05\)
- Answer
-
- For the Main Effect of IV 1 (Congruency): \(F_{Crit} (1, 46) = 4.08\) (if you round down) or 4.03 (if you find the nearest df of the denominator). With an \(F-{Calc} = 739.94\), we reject the null hypothesis.
- For the Main Effect of IV 2 (Posture): \(F_{Crit} (1, 46) = 4.08\) (if you round down) or 4.03 (if you find the nearest df of the denominator). With an \(F_{Calc} = 41.44\), we reject the null hypothesis.
- For the Interaction: \(F_{Crit} (1, 46) = 4.08\) (if you round down) or 4.03 (if you find the nearest df of the denominator). With an \(F_{Calc} = 8.42\), we reject the null hypothesis.
That wasn't so hard, but now what?
What would the statistical sentences look like for each effect?
Solution
- Main Effect of IV 1 (Congruency): F(1, 46)=739.94,p<.05
- Main Effect of IV 2 (Posture): F(1, 46)=41.44,p<.05
- Interaction: F(1, 46)=8.42,p<.05
Before we can write the conclusion, we need to know the means and see if they are in the direction that we hypothesized way back in Step 1. The means are shown in the Punnett's Square in Table \(\PageIndex{3}\).
| IV Levels | IV1: Congruent | IV1: Incongruent | Marginal Means for IV2 |
|---|---|---|---|
| IV2 (Posture): Sitting | 821.92 | 940.79 | 881.35 |
| IV2 (Posture): Standing | 807.96 | 903.91 | 855.94 |
| Marginal Means for IV1 | 814.94 | 922.35 | (You could put the Total Mean here) |
Oh, snap, what about post-hoc pairwise comparisons?
The good news is that pairwise comparisons aren't necessary to calculate with either statistically significant main effect because both of our IVs only have two levels. When we rejected the null hypothesis for the main effects, we determined that the bigger of the two means was statistically bigger.
But what about the interaction? We rejected that null hypothesis, too! And as we discussed in the prior section, pairwise comparisons are necessary when the null hypothesis for an interaction is rejected. However, just like the Sums of Squares are more of a hassle to do by hand than is worth it for factorial designs, the post-hoc analyses are also confusing to calculate with the combinations of cells. Instead, let's find the pairwise mean differences, and compare them to a critical value of 14.86; any mean differences that have an absolute value larger than 14.86 are statistically significantly different.
Calculate the mean differences for each pair of means in the interaction, and determine which are statistically significantly different when the critical value is 14.86.
Solution
| Pairs Being Compared | Mean Difference | Statistically Significant? |
|---|---|---|
| Congruent while Sitting minus Congruent while Standing | 13.96 | No (13.96 is smaller than the critical value of 14.86) |
| Congruent while Sitting minus Incongruent while Sitting | -118.87 | Yes |
| Congruent while Sitting minus Incongruent while Standing | -81.99 | Yes |
| Congruent while Standing minus Incongruent while Sitting | -132.83 | Yes |
| Congruent while Standing minus Incongruent while Standing | -95.95 | Yes |
| Incongruent while Sitting minus Incongruent while Standing | 36.88 | Yes |
Based on these calculations, all of the pairwise comparison are statistically significant (the mean differences are larger than the critical value of 14.86) except for the combination of Congruent while Sitting compared with Congruent while Standing.
We are ready to do the write-up! To remind ourselves of the research hypotheses, let's list them here and identify if they were supported or not.
For IV 1, Congruency, Dr. MO predicted a main effect such that participants will react faster (smaller reaction time) when the words and colors match (Congruent) than when they do not match (Incongruent). This prediction was supported because there was a significant main effect (F(1, 46) = 739.94, p<.05). Looking at the means in Table \(\PageIndex{3}\), the Congruent group (M = 814.94 ms) did have a faster (smaller) reaction time than the Incongruent group (M = 922.35 ms).
For IV 2, Posture, Dr. MO predicted a main effect such that participants react faster while standing rather than sitting. This prediction was supported because there was a significant main effect F(1, 46) = 41.44, p<.05). Looking at the means in Table \(\PageIndex{3}\), the Standing group (M = 855.94 ms) did have a faster (smaller) reaction time than the Sitting group (M = 881.35 ms).
Dr. MO predicted an interaction such that reaction time seems to be even faster for congruent words when standing than sitting, with participants with incongruent words while sitting being particularly slow to react to. There was a significant interaction F(1, 46) = 8.42, p<.05). Looking at the means in Table \(\PageIndex{3}\) and the mean differences in Table \(\PageIndex{4}\), this prediction was partially supported. It is true that participants were particularly slow to react to incongruent words while sitting (M = 940.79), but reaction times did not differ for congruent words while standing (M = 807.96) compared to sitting (M = 821.92).
Oops, we accidently just did the whole write-up!
Are all of the four required components when Reporting Results included?
Solution
- The statistical test is preceded by the descriptive statistics (means)- We included almost all of the means in the actual write-up, and directed readers to the tables with all of the means.
- The description tells you what the research hypothesis being tested is- Yes, each paragrph re-stated what the prediction was.
- A "statistical sentence" showing the results is included- Yes, each prediction had a "statistical sentence."
- The results are interpreted in relation to the research hypothesis- Yes, it was stated whether the research hypotheses (predictions) were supported, or partially supported.
Summary of Stand At Attention
Another way to think about this is to look at the mean differences for the Stroop effect (which was the main effect of IV 1, the difference between the congruent condition and the incongruent condition).
- In the sitting condition the Stroop effect was roughly 941-822=119 ms.
- In the standing condition the Stroop effect was roughly 904-808=96 ms.
So, the Stroop effect was 119-96=23 ms smaller when people were standing. This is a pretty small effect in terms of the amount of time reduced, but even though it is small, a difference even this big was not very likely to be due to chance.
Based on this research there appears to be some support for the following logic chain. First, the researchers can say that standing up reduces the size of a person’s Stroop effect. Fine, what could that mean? Well, if the Stroop effect is an index of selective attention, then it could mean that standing up is one way to improve your ability to selectively focus and ignore distracting information. The actual size of the benefit is fairly small, so the real-world implications are not that clear. Nevertheless, maybe the next time you lose your keys, you should stand up and look for them, rather than sitting down and not look for them.
Let's try one more practice, this time with mindset data!