
14.10: Correlation Exercises
- Page ID
- 18130

Exercise \(\PageIndex{1}\)
What does a correlation assess?
- Answer
-
Correlations assess the strength and direction of a linear relationship between two quantitative variables.
Exercise \(\PageIndex{2}\)
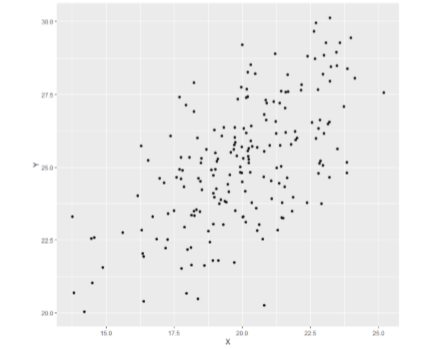
What sort of relation is displayed in the scatterplot in Figure \(\PageIndex{1}\) below?
- Answer
-
Strong, positive, linear relation
Exercise \(\PageIndex{3}\)
Create a scatterplot from the following data:
| Hours Studying | Overall Class Performance |
|---|---|
| 0.62 | 2.02 |
| 1.50 | 4.62 |
| 0.34 | 2.60 |
| 0.97 | 1.59 |
| 3.54 | 4.67 |
| 0.69 | 2.52 |
| 1.53 | 2.28 |
| 0.32 | 1.68 |
| 1.94 | 2.50 |
| 1.25 | 4.04 |
| 1.42 | 2.63 |
| 3.07 | 3.53 |
| 3.99 | 3.90 |
| 1.73 | 2.75 |
| 1.9 | 2.95 |
- Answer
-

Figure \(\PageIndex{2}\): Scatterplot of data from Table \(\PageIndex{1}\). (CC-BY-NC-SA Foster et al. from An Introduction to Psychological Statistics)
Exercise \(\PageIndex{4}\)
Using the data from Table \(\PageIndex{1}\), test for a statistically significant relation between the variables.
- Answer
-
Step 1:
Research Hypothesis: “There is a positive linear relation between time spent studying and overall performance in class.”
Null Hypothesis “There is no liner relation between time spent studying and overall performance in class.”
Step 2: \(df = 15 – 2 = 13, \alpha = 0.05, r_{Crit} = 0.514\).
Step 3: Using the Sum of Products table, you should find: \(\overline{X_{HS}} = 1.65, \overline{X_{OCP}}= 2.95, r = 0.65\). [Your means might differ due to rounding differences.
Step 4: Obtained statistic is greater than critical value, reject \(H_0\). There is a statistically significant, strong, positive relation between time spent studying (\(\overline{X_{HS}} = 1.65) and performance in class (\overline{X_{OCP}}= 2.95), \(r(13) = 0.65, p < .05\). This supports the research hypothesis.
Contributors and Attributions
Foster et al. (University of Missouri-St. Louis, Rice University, & University of Houston, Downtown Campus)