
6.5: Tables and Figures
- Page ID
- 18420

\( \newcommand{\vecs}[1]{\overset { \scriptstyle \rightharpoonup} {\mathbf{#1}} } \) \( \newcommand{\vecd}[1]{\overset{-\!-\!\rightharpoonup}{\vphantom{a}\smash {#1}}} \)\(\newcommand{\id}{\mathrm{id}}\) \( \newcommand{\Span}{\mathrm{span}}\) \( \newcommand{\kernel}{\mathrm{null}\,}\) \( \newcommand{\range}{\mathrm{range}\,}\) \( \newcommand{\RealPart}{\mathrm{Re}}\) \( \newcommand{\ImaginaryPart}{\mathrm{Im}}\) \( \newcommand{\Argument}{\mathrm{Arg}}\) \( \newcommand{\norm}[1]{\| #1 \|}\) \( \newcommand{\inner}[2]{\langle #1, #2 \rangle}\) \( \newcommand{\Span}{\mathrm{span}}\) \(\newcommand{\id}{\mathrm{id}}\) \( \newcommand{\Span}{\mathrm{span}}\) \( \newcommand{\kernel}{\mathrm{null}\,}\) \( \newcommand{\range}{\mathrm{range}\,}\) \( \newcommand{\RealPart}{\mathrm{Re}}\) \( \newcommand{\ImaginaryPart}{\mathrm{Im}}\) \( \newcommand{\Argument}{\mathrm{Arg}}\) \( \newcommand{\norm}[1]{\| #1 \|}\) \( \newcommand{\inner}[2]{\langle #1, #2 \rangle}\) \( \newcommand{\Span}{\mathrm{span}}\)\(\newcommand{\AA}{\unicode[.8,0]{x212B}}\)
Tables are where you put rows or columns of numbers, like a frequency table or your calculation results. A figure is a chart/graph or other picture. The 7th Edition allows you to put the tables and figures in the main body of the paper, but you can also put them on their own pages at the end of your paper.
- Tables and Figures can be single-spaced.
- Tables and Figures must be numbered, in bold (Example: Figure 1 or Table 1). The table or figure number should be on a line above the title.
- Tables and Figures must have a title (in italics) on the line below the number.
- In a Table, the column titles should be underlined.
- There should be a line across the whole bottom edge of each table.
If you are putting a table or figure in an appendix, then each set of tables or figures should be started on a new page [Insert a Page Break, don’t hit enter a bunch of times].
Example Table Formatting
Table 1
Measures of Central Tendency and Standard Deviation
|
Groups |
N |
Mean |
Median |
Mode |
SD |
|---|---|---|---|---|---|
|
Group 1 |
34 |
9 |
2 |
6.50 |
2.51 |
|
Group 2 |
550 |
246.99 |
45.5 |
22.22 |
5.54 |
| Note: “SD” is “standard deviation. | |||||
Example Chart Formatting
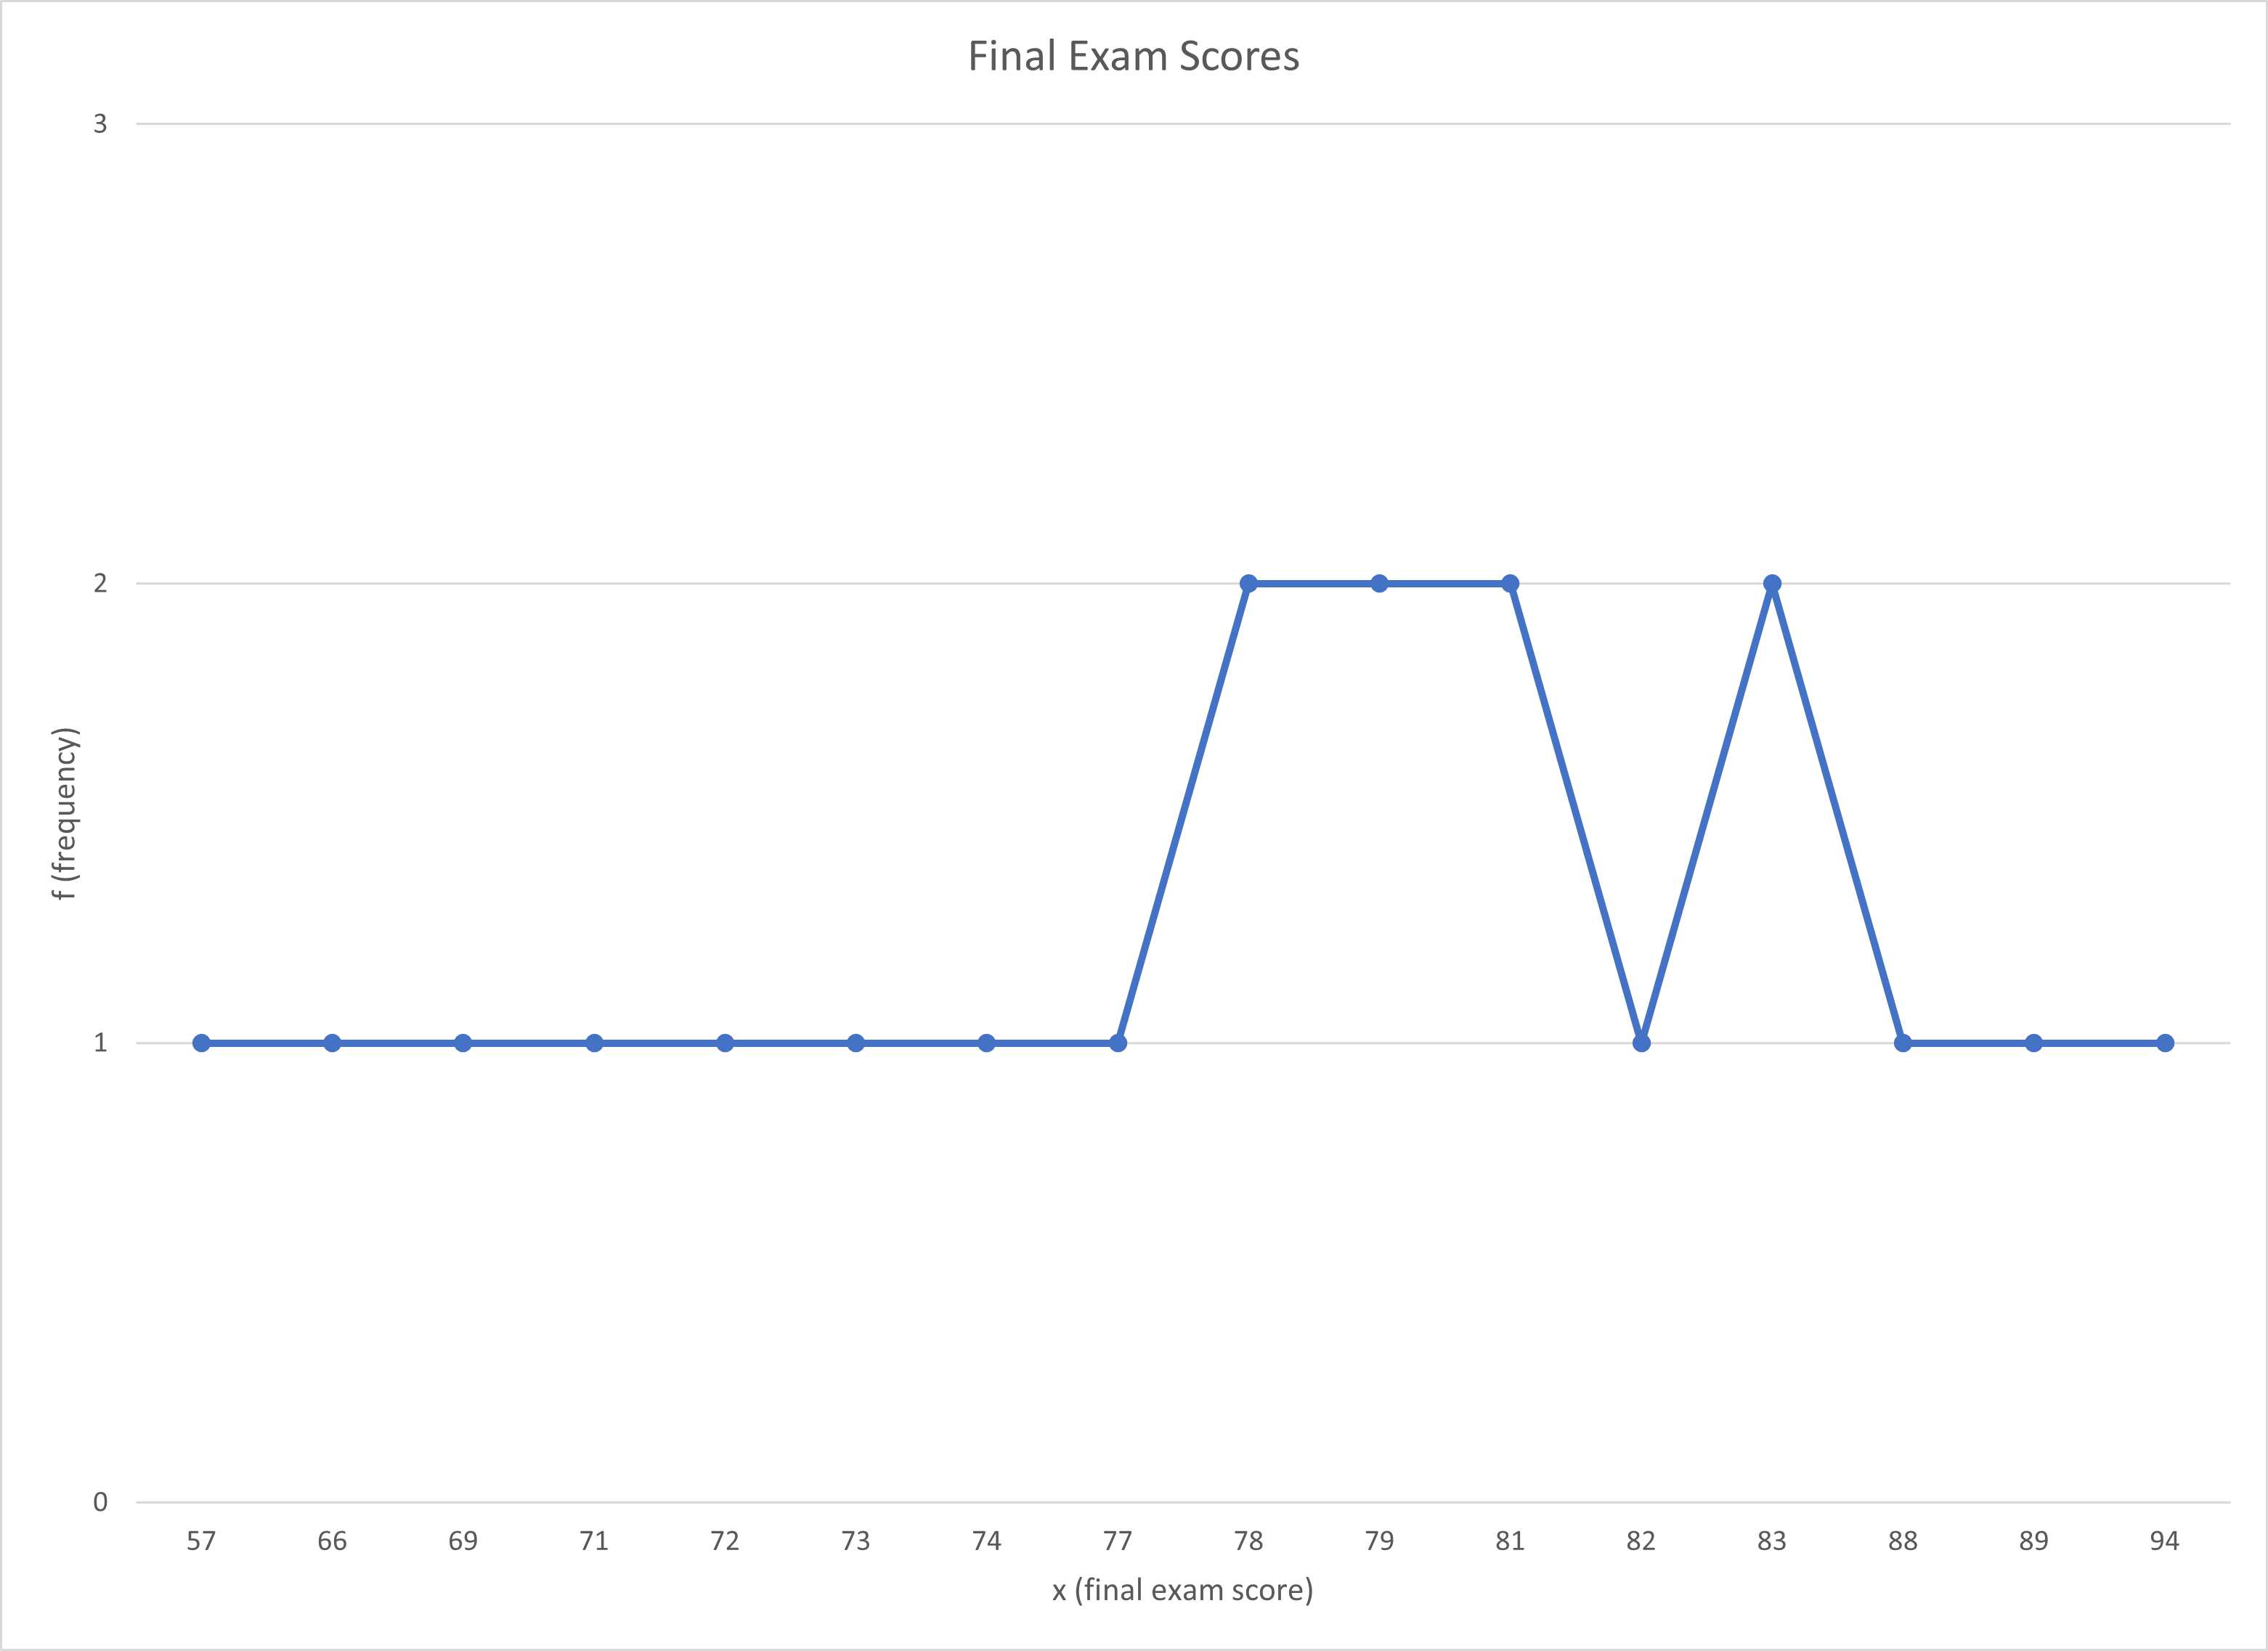
Figure 1
Frequency of Final Exam Scores
A summary of formatting in APA Style is up next!