
5.1: Introduction to z-scores
- Page ID
- 17337

\(Z\)-scores and the standard normal distribution go hand-in-hand. A \(z\)-score will tell you exactly where in the standard normal distribution a value is located, and any normal distribution can be converted into a standard normal distribution by converting all of the scores in the distribution into \(z\)-scores, a process known as standardization.
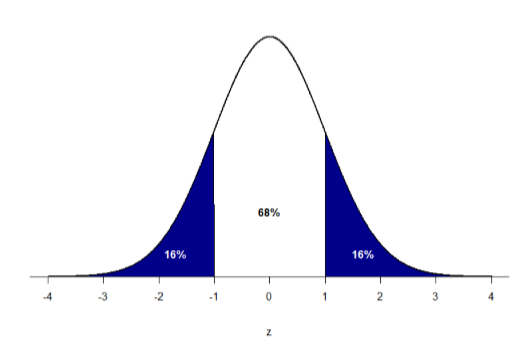
We saw in the previous chapter that standard deviations can be used to divide the normal distribution: 68% of the distribution falls within 1 standard deviation of the mean, 95% within (roughly) 2 standard deviations, and 99.7% within 3 standard deviations. Because \(z\)-scores are in units of standard deviations, this means that 68% of scores fall between \(z\) = -1.0 and \(z\) = 1.0 and so on. We call this 68% (or any percentage we have based on our \(z\)-scores) the proportion of the area under the curve. Any area under the curve is bounded by (defined by, delineated by, etc.) by a single \(z\)-score or pair of \(z\)-scores.
An important property to point out here is that, by virtue of the fact that the total area under the curve of a distribution is always equal to 1.0 (see section on Normal Distributions at the beginning of this chapter), these areas under the curve can be added together or subtracted from 1 to find the proportion in other areas. For example, we know that the area between \(z\) = -1.0 and \(z\) = 1.0 (i.e. within one standard deviation of the mean) contains 68% of the area under the curve, which can be represented in decimal form at 0.6800 (to change a percentage to a decimal, simply move the decimal point 2 places to the left). Because the total area under the curve is equal to 1.0, that means that the proportion of the area outside \(z\)= -1.0 and \(z\) = 1.0 is equal to 1.0 – 0.6800 = 0.3200 or 32% (see Figure \(\PageIndex{1}\) below). This area is called the area in the tails of the distribution. Because this area is split between two tails and because the normal distribution is symmetrical, each tail has exactly one-half, or 16%, of the area under the curve.
We will have much more to say about this concept in the coming chapters. As it turns out, this is a quite powerful idea that enables us to make statements about how likely an outcome is and what that means for research questions we would like to answer and hypotheses we would like to test. But first, we need to make a brief foray into some ideas about probability.